
Welcome to my yearly blog post on crowdfunding and games, looking at how well games have performed on Kickstarter (and Fig) for the past year. Read more
Welcome to my yearly blog post on crowdfunding and games, looking at how well games have performed on Kickstarter (and Fig) for the past year. Read more
This is the yearly look at what is the most important game event in Europe, and the coverage it has generated around its latest edition. Read more
As an addition to the traditional mid-year crowdfunding check, for video games, I have decided to give tabletop games their own blog post this year. There is a dedicated interest for these numbers, and they are quite fascinating to follow.
As a quick catch-up, you might want to have a look at the post on the year 2017 performance for games on Kickstarter.
Let’s get started with the question I always get when talking about the ongoing performance of the tabletop category on Kickstarter: is the bubble bursting yet?
Well. Nope.
And it’s hard to say if it is indeed a bubble at all, considering how steady the growth has been.
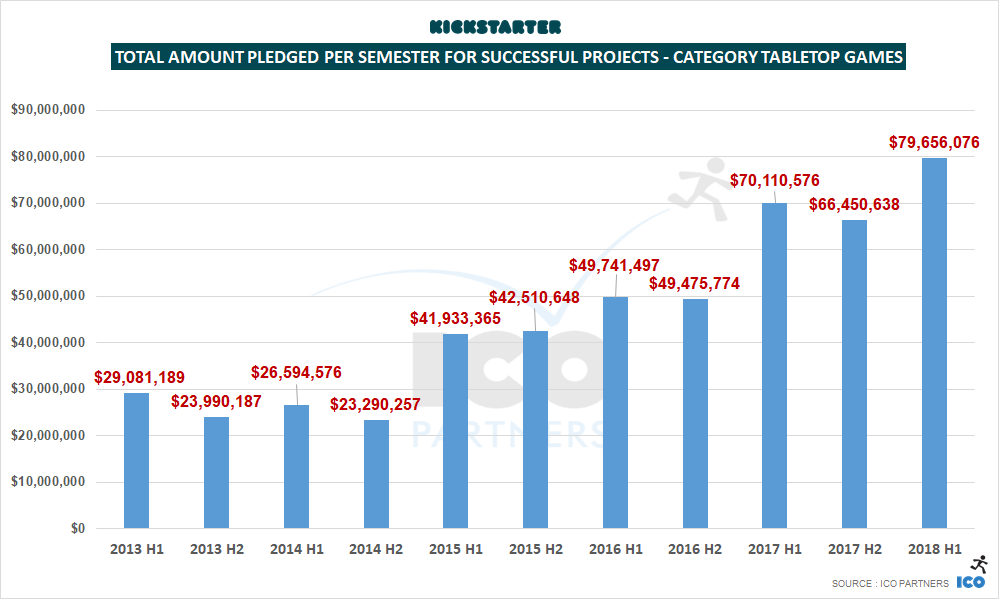
Tabletop games have almost raised $80m in just 6 months this year.
Tabletop Games have raised more money than any other category on the platform during the period, and represent 30% of all the money raised on Kickstarter.
As a reminder, Tabletop Games were representing 23% of all the money raised on Kickstarter in the year 2017, and if there is a trend in seasonality we can see, it is that the second half of a year is usually bigger for projects of that subcategory.
I normally don’t use gifs in blog posts, I feel this warrants an exception.

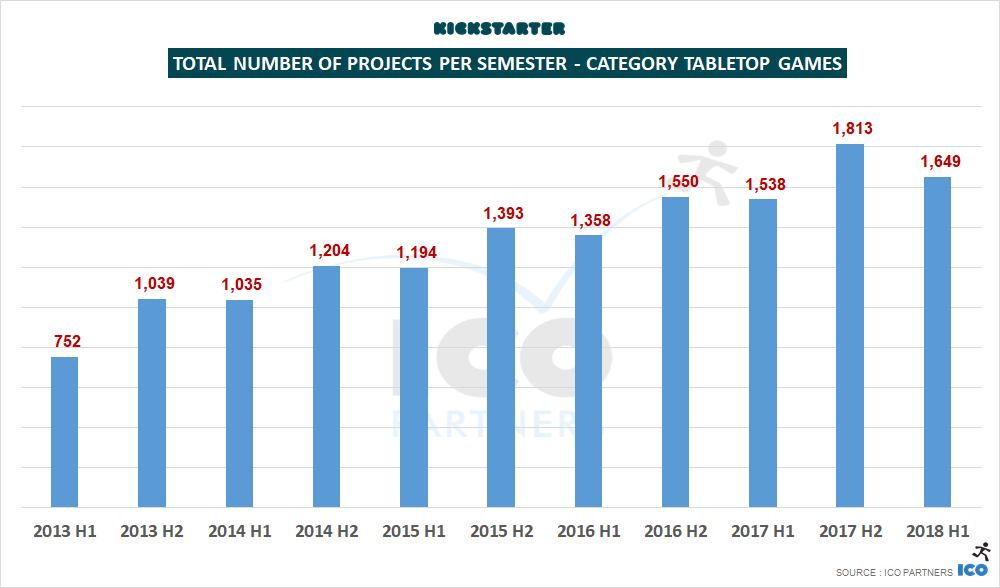
Looking into the total number of campaigns launched on the platform, we can see a drop from the previous period.
However, this is in line with previous years, which see fewer campaigns during the first half of a year.
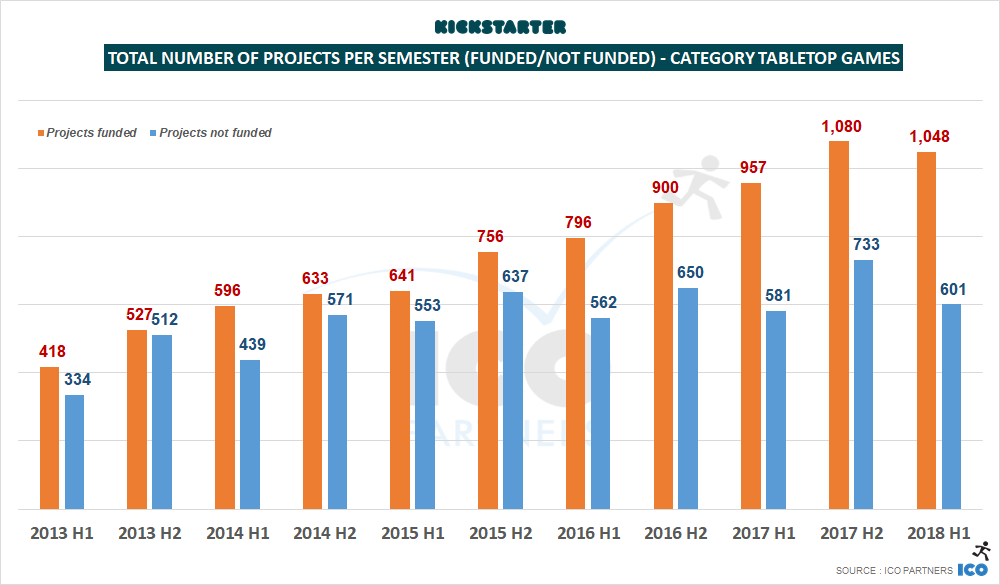
Looking at projects that got funded, we can also observe a drop where there has been a constant growth for the past five years. This is the first sign of either some fatigue, or maybe we have reached the critical mass of unique, quality tabletop projects that can be submitted in a given period. There has to be a ceiling on how many of these projects can exist.
What is important to note as well, though, is that the number of projects that failed has dropped by a higher ratio than the number of funded projects. Like for the video games projects, this shows a decrease in the number of projects going to the platform unprepared, or the drop of purely opportunistic projects. (Remember the potato salad effect? This might be the tail end of it.)
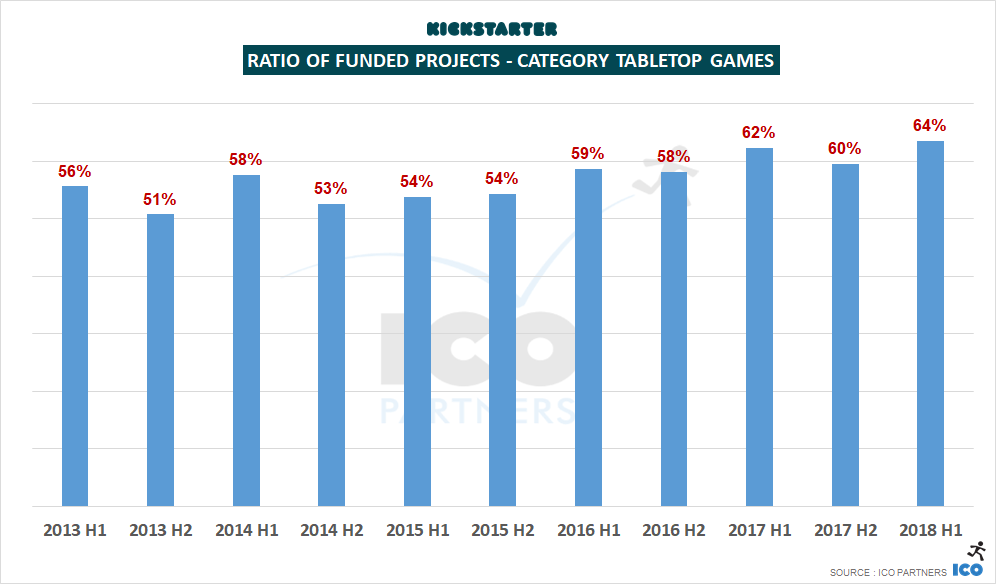
Despite a drop in the total number of projects that got funded, we end up with the highest “success ratio” for tabletop games ever.
Almost two thirds of the tabletop campaigns manage to reach their goal.
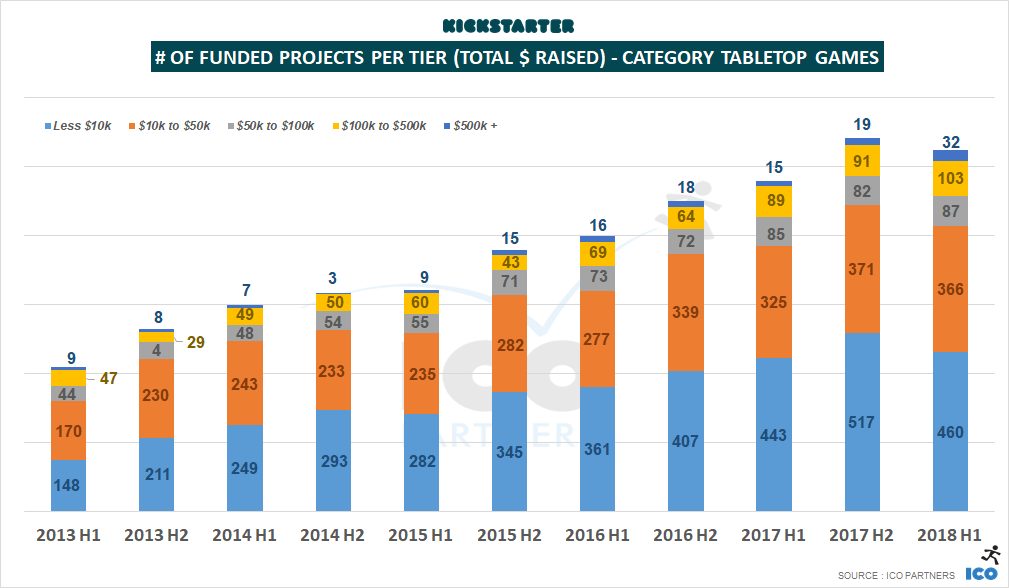
Looking at which tiers see a drop in the number of funded projects, we see a similar pattern to the video games update, with lower tiers suffering a drop in numbers:
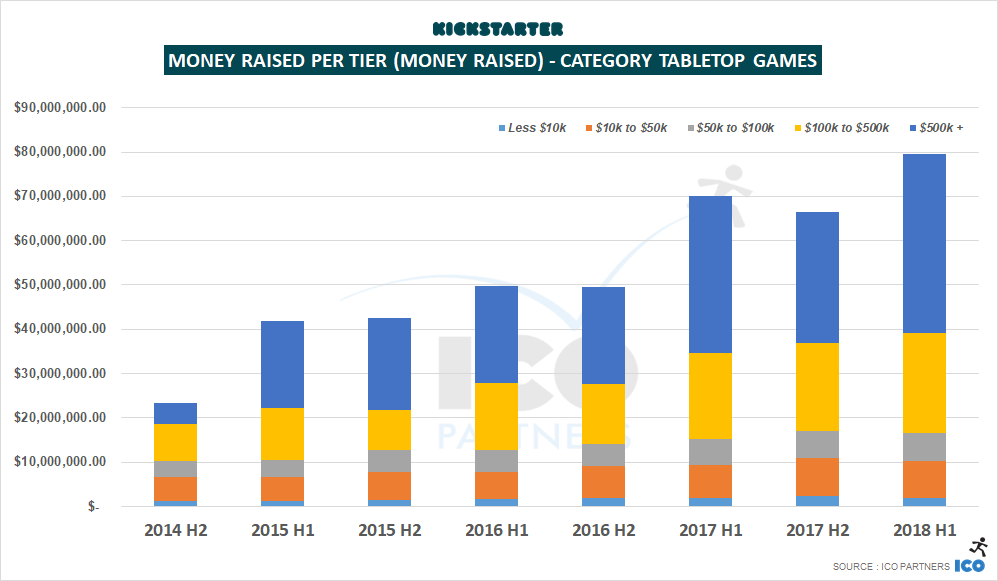
Looking into the amount of money raised per tiers, we can observe a few more things:
I have had a very cursory look at other crowdfunding platforms, especially Ulule, Game On Tabletop, and Indiegogo, that all have tabletop games projects submitted to them on a regular basis. I have not been able to include them in this analysis though – the amount of time it would require to parse their projects, as they are not using the same categories as Kickstarter, was too significant in comparison to their relative size to Kickstarter. It would also require to filter projects that are reported in these platforms when they were in fact funded on Kickstarter and the platforms are used for Slacker/Late Backers campaigns or for pledge management.
Kickstarter is where most of the funding happens, and the overall trends can be taken from its numbers.
The bubble is not bursting. If anything, there are signs of reaching a stable critical mass for tabletop projects. What is a more important take away to me is that games are now the cornerstone of Kickstarter, despite having very few features in place specifically to support them.
The Games category, taken as a whole, represents more than a third of all the money pledged to Kickstarter so far in 2018. It might be strategic for the platform to consider looking into building on that strength, or it will be leaving open this opportunity to one of the competing platforms.

It has already been six months since my last check on the crowdfunding trends for video games. With everyone taking it slow because the summer is coming (I am joking, everyone is rabidly preparing for gamescom), here is the latest data and what I make of it. This is part one, as I will do another blog post on Tabletop Games. Read more
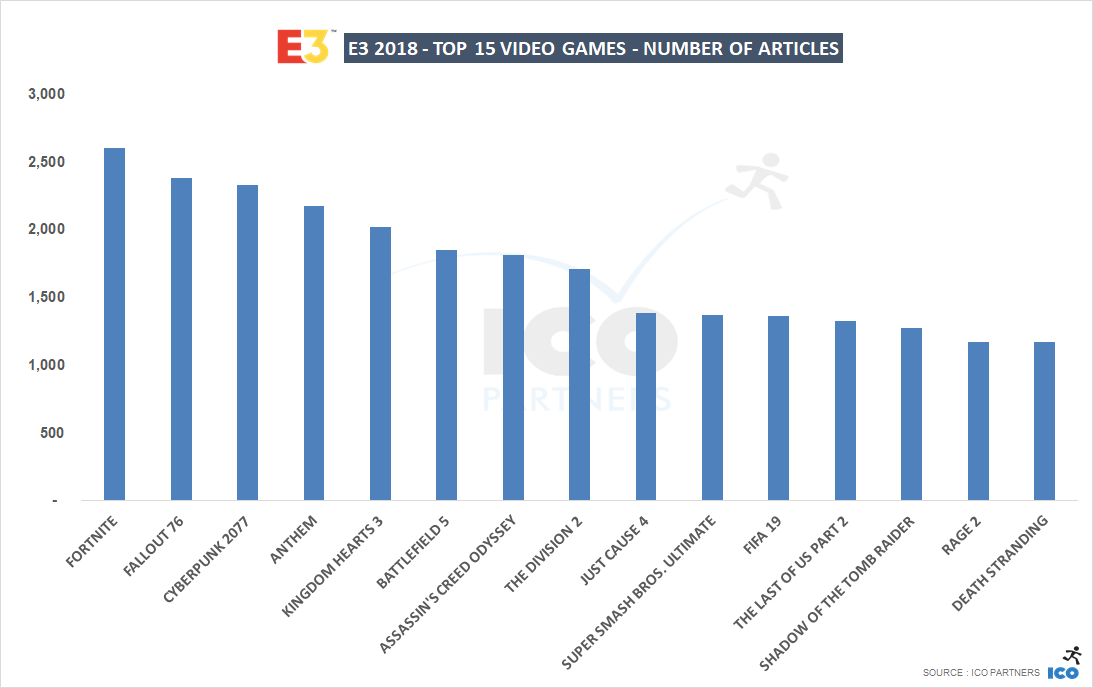
Like every year, this is the time for a look at the performance of the many E3 announcements in terms of media coverage.
If this the first time you read about our analysis, you can find out more about the methodology used, and read the blog posts for 2015, 2016, and 2017.
Starting with 2016, I set up a media tracker to measure the media coverage for the E3 itself. It tracks all the articles that mention the event, and is a good indicator of the scale of a particular year’s crop.

As you can see, 2018 was a decline year in terms of total volume of media articles mentioning the event. I am not sure this should be particularly worrying, or even surprising. While there were great games revealed during the week, it was also particularly light on industry-changing announcements.
We are well into the cycle of this generation of consoles, while the rumours on the next gen are growing, there was nothing to feed many articles. The same goes for new technologies, like VR and the impact it had over the past two E3s.
It’s good to note that there has been a decline, and while it is merely a 5.5% drop, for an event of that scale, it could be an indicator of a trend.
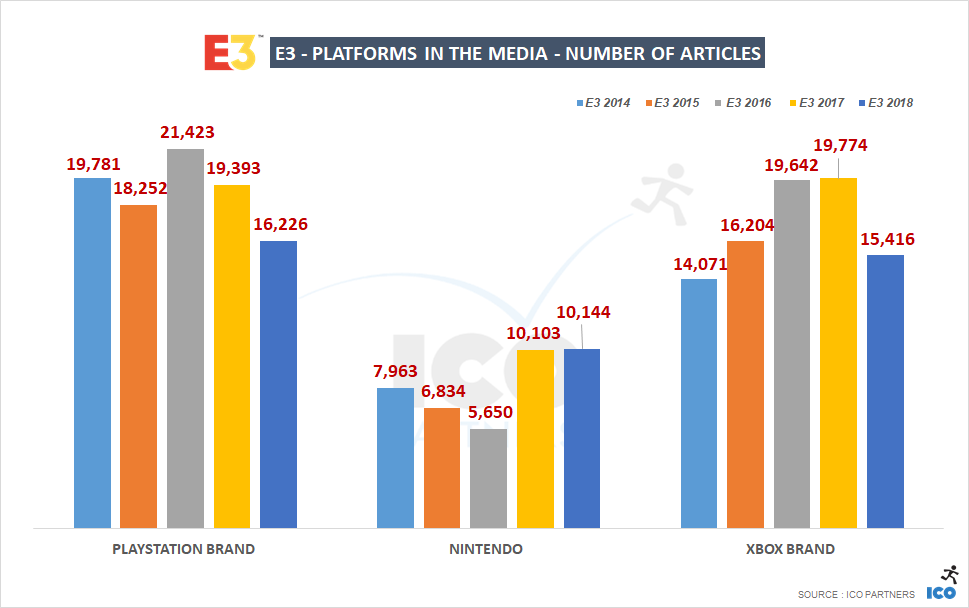
Looking at the performance of the key brands for the consoles, the downward trend is much more significant. It is the worst year for the PlayStation since we started measuring, and the worst year for Microsoft since 2014.
I have to confess I am surprised that Microsoft’s performance ended being at this level. I felt they had a very good conference, and while their line-up is still behind, they had better announcement than last year. It seems like it wasn’t enough to compensate a hardware communication, like the Xbox One X and the Xbox One S last year.
As for Nintendo, 2018 was their best year, even if, arguably, the volume of articles mentioning them is very close to last year’s.
This validates very much Nintendo’s strategy to not have a traditional press conference. At the very least, it doesn’t seem to prevent them to secure a significant volume of media coverage. Nintendo also benefitted for the first time in a while from the media coverage around 3rd party titles, with their Fortnite announcement being spot on with the current Battle Royale frenzy.
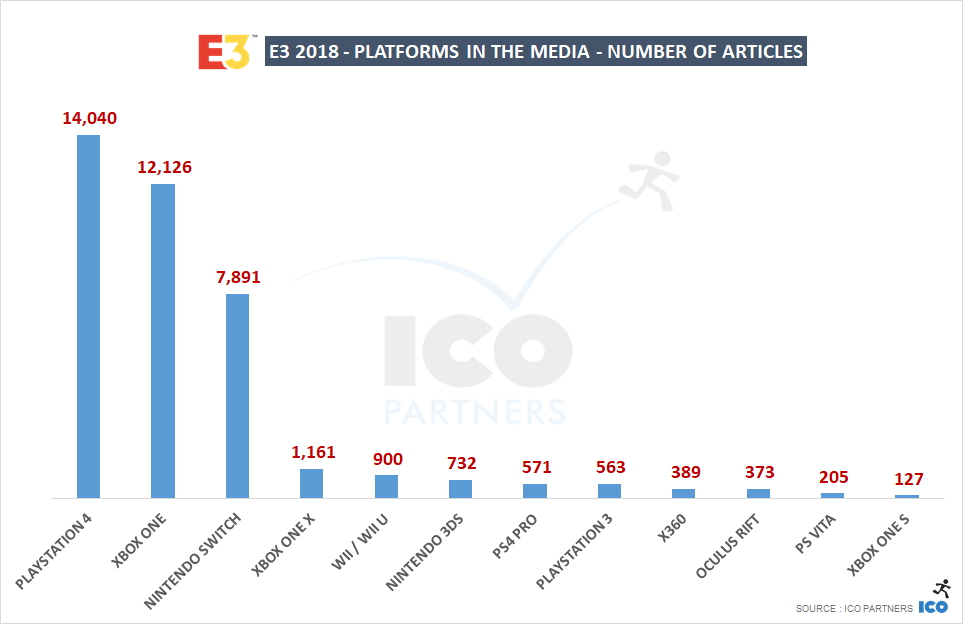
Looking at the specific platforms mention, we find the same ranking in the top 3. What is significant though here is that the platforms outside of these three consoles have ridiculously low coverage numbers compared to previous years.
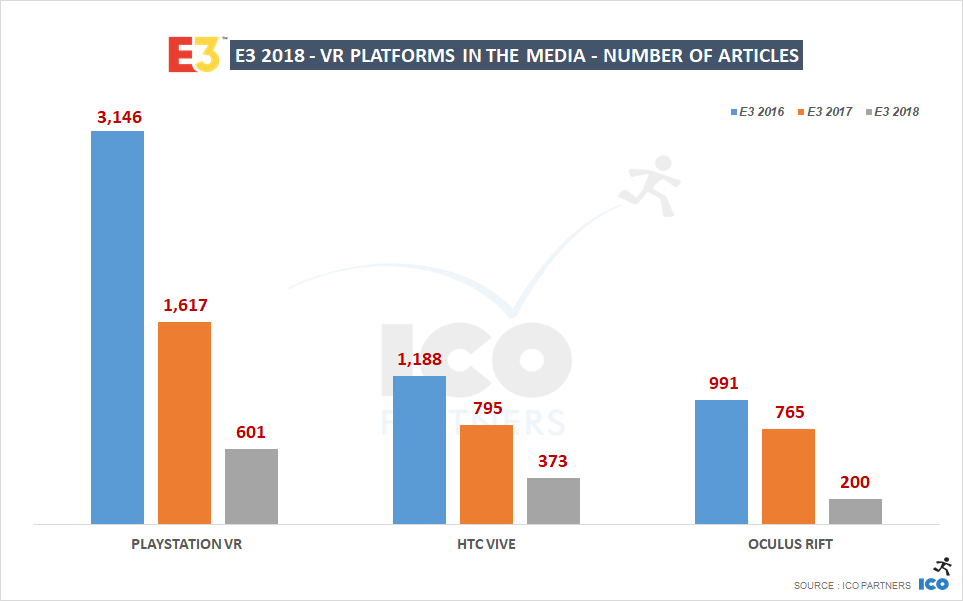
And in case you were wondering, E3’s fling with VR is mostly over.
This is my read on those numbers:
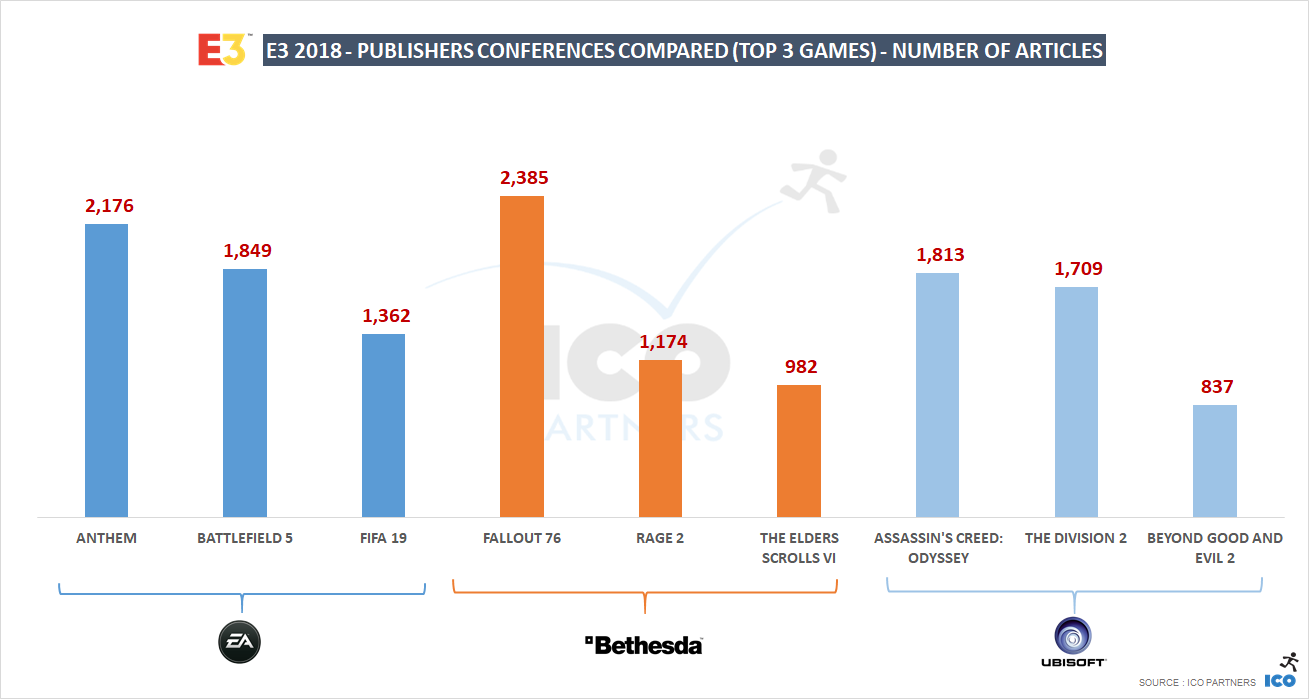
Looking at the most mentioned games from the three largest studios with a press event, this year’s numbers are lower than last year’s.
It is quite notable in the case of EA’s games. There has been a decline in the coverage received for their most covered games compared to last year’s. It might come from the fact the lack of renewal of their franchise, considering their 3 most covered in 2017 were Anthem (same as this year, without the novelty factor), Star Wars Battlefront 2 (another FPS from DICE), and FIFA 18 (yearly cycle doesn’t help standing out).
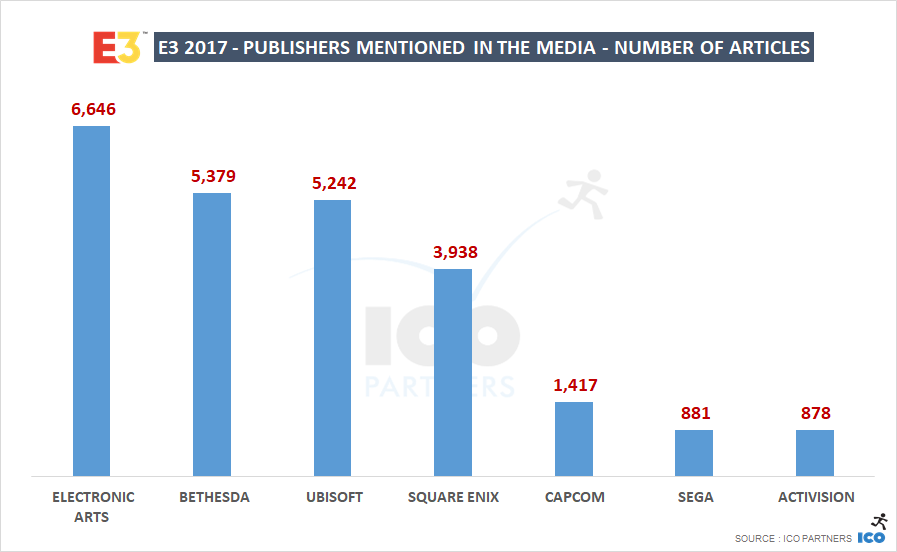
On the overall coverage mentioning the publishers’ brand, Electronic Arts is still ahead. The notable changes from last year is the relative growth of Bethesda’s presence, taking the second spot away from Ubisoft that saw a drop. Also interesting is the seemingly lack of interest in Activision in this year’s E3, losing its ranking at 6th to SEGA.
This E3 was very much an intermerdiary year. Despite some very exciting games being revealed, the overall numbers are lower than previous year. It sets up 2019 to be a very exciting edition.
I am also looking forward to the next press conferences from Nintendo and Sony, who have not been shy in keeping bombshell announcements for their non-E3 communications.

You might be familiar with the different analysis we conduct around key media events of the games industry, such our regular E3 and gamescom media coverage analysis.
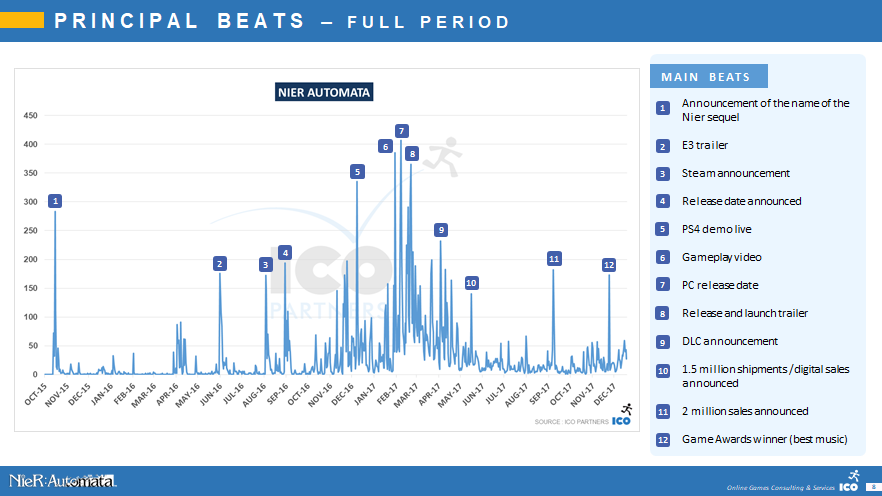
We have in the past used the same tools to help games companies better understand their PR actions and identify ways for them to improve their reach. I have been meaning to build a simple case study to illustrate this type of analysis and today we are releasing a case study on the media coverage of Nier: Automata.
Why do this case study?
The modern media landscape is evolving very quickly. With these changes, we see new media emerging, and we are also in a better position to measure and understand the impact of specific communication efforts.
However, there are not many benchmarks around to compare performance of these actions. By building a case study, albeit around a popular game, this is a first step towards providing reference points in that field.
Why using Nier: Automata for this?
We wanted to study a game that has been a clear success, with a significant volume of coverage across multiple territories to have statistically relevant numbers.
We avoided titles that have been so successful at securing coverage that anything we would have uncovered would be useless to anyone as it would have been a “black swan”, unique on its own.
I had selected a few potential titles, and I let Twitter decide:
https://twitter.com/icotom/status/888049917482160128
What was the methodology used?
We used our internal Media Monitor, a tool used for many of our PR intelligence missions and related blog posts. You can find details on the tool over here: https://icopartners.com/2014/06/pr-monitoring-working/
The report is short and to the point – it looks at how well different beats performed for Nier: Automata, from an online media coverage perspective.
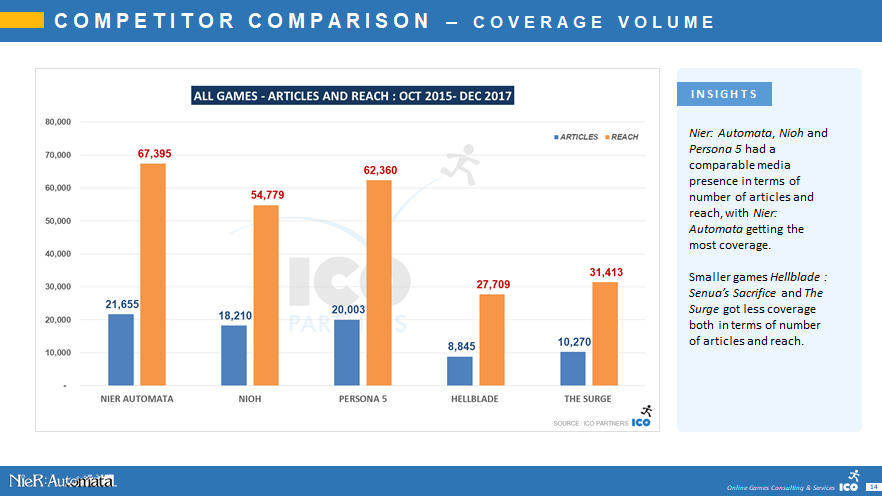
And we compared Nier: Automata to a handful of games that seemed relevant because of their genre and their release window.
The report is free to download on Gumroad – and you can find it and our other reports in the Publication section of the website.