The unamusing data analysis of four recent examples

[Update: The Rocket League team have been in touch with and clarified this year’s April Fool’s prank was – unlike the assumption made by us and several other news outlets – not actually made by them, but rather a community site. We added an additional paragraph in the Rocket League section on this post to reflect this.] 

Traditionally, on every April 1st countless game makers pull off April fools’ jokes, with at least as many gamers and more importantly media laughing or complaining about them. This raises the question of whether cooking up an April fool’s joke could be more than just an enjoyable team building exercise, and actually be a strong PR tool for your game? The short answer: yes! Just kidding: like almost everything in PR it depends on circumstance.

To try answer the above question more in-depth, we analysed some general data from this year’s jokes. We also examined four very different examples in greater detail. The data below should hopefully help you decide whether participating in next years April’s fool’s fun is worth your PR resources.


2016’s April pranks PR performance comparison

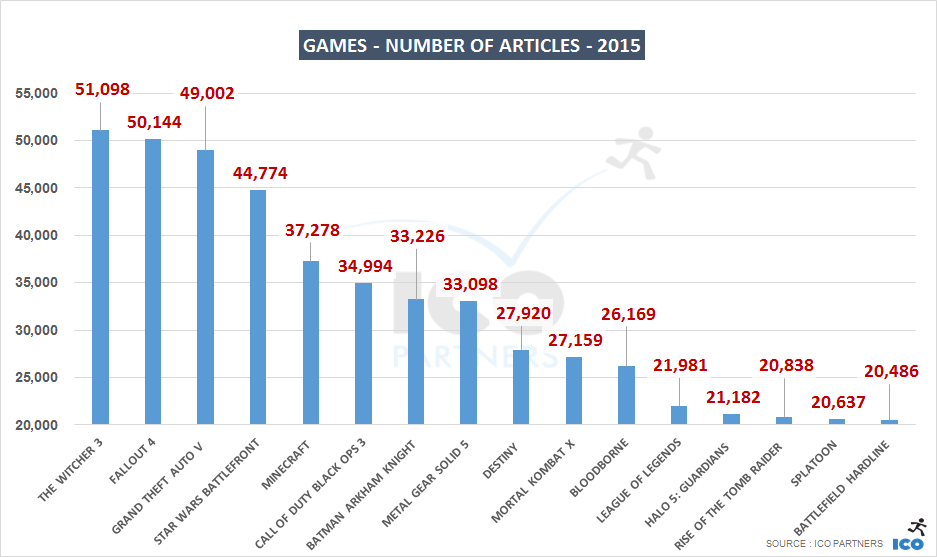
In the graph below you can see the general ranking of this year’s April fools’ jokes according to how many articles they generated in media. For more info on the tracking method please read this entry. Please also note that this selection excludes several jokes – such as Hearthstones fake MMO – due to it being a too much of a generic name for our tool to track consistently. Furthermore, other stunts that didn’t get enough coverage to be tracked, were also excluded.

general_articles

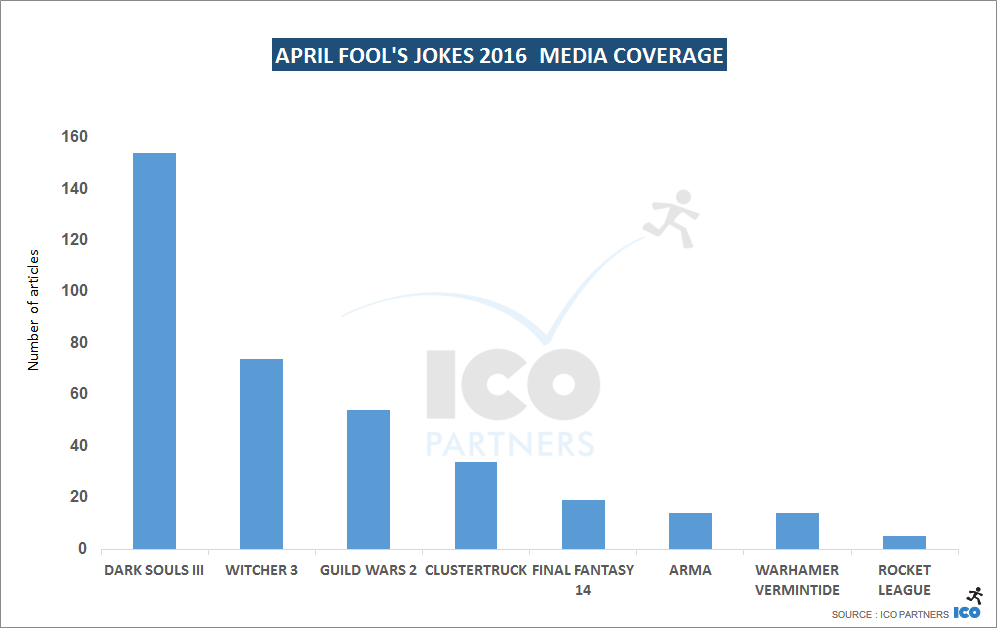
If you are interested in what the actual joke for the games in the graph were, I have listed links to them at the very end at the article but now back to the coverage graph. Unsurprisingly, big brands like The Witcher 3 and Dark Souls III led the coverage charts. However, the fact that a small title like Clustertruck gained more traction than big brands like Final Fantasy 14 and most notably Rocket League, shows that a strong name doesn’t necessarily guarantee coverage when the idea or execution of the PR stunt isn’t quite right.

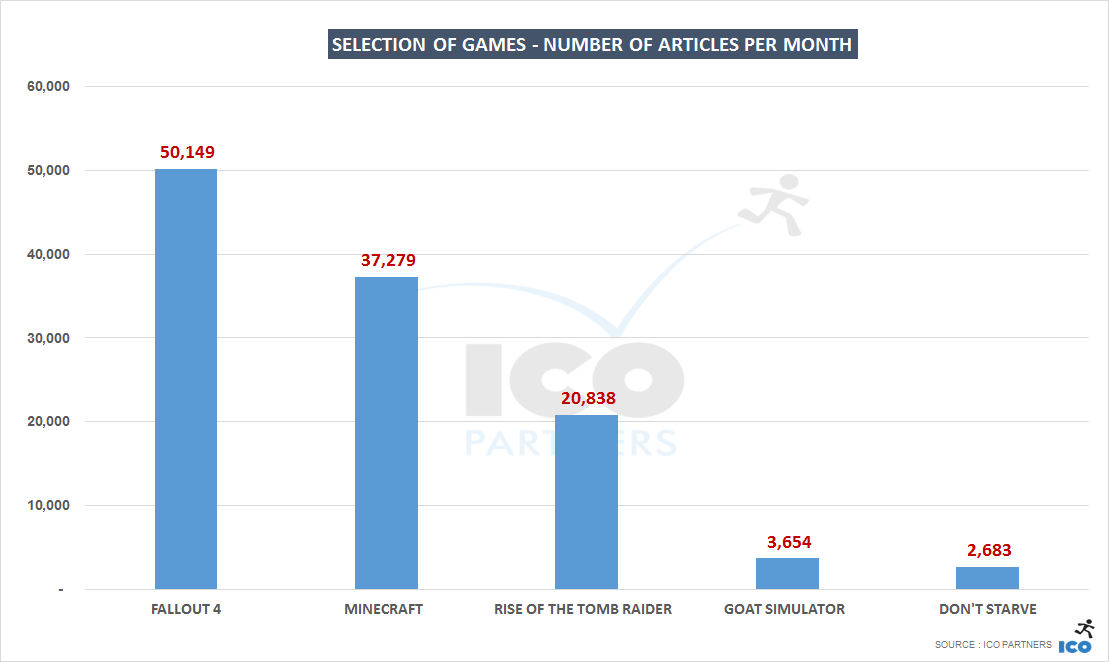
In the four example case studies analysed, we take a look at what helped or hindered these stunts. But first let’s have a quick look at how the different games’ related videos performed on YouTube.

general_youtube

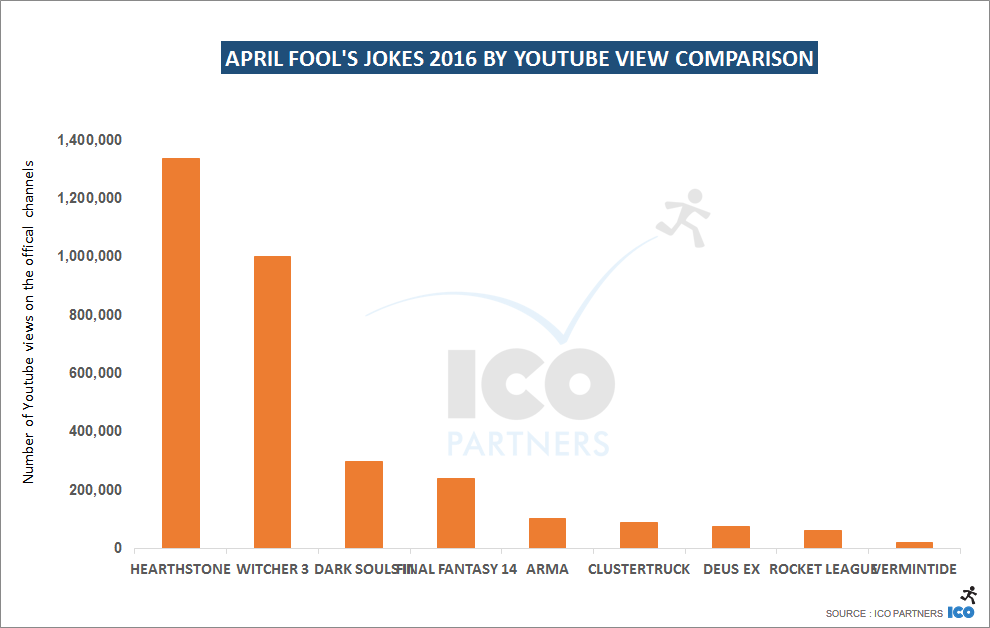
As mention before we couldn’t track Hearthstone’s MMO joke in terms of coverage but it still included in the Youtube overview graph which it is leading – most likely due to Blizzard’s strong community. While Dark Souls III was a very hot topic in the number of articles it was featured in, it was far less popular on YouTube compared to the Witcher 3. One explanation for this could be that news outlets were eager to pick up on the Dark Souls III news, as the game was due to be released a week after. Therefore, references to Dark Souls III would most certainly generate traffic on articles. However, in reality the audience wasn’t too impressed by the video itself, leading to the smaller numbers of views.

The big difference in coverage and YouTuber numbers could also be related to a variety of other factors, such as the Witcher 3 simply pushing video content more or having a stronger YouTube community.

Lets look at our four, hand-picked examples in a bit more detail.


Case Study 1
The Witcher 3: Wild Hunt with “Roach”

The Witcher 3’s joke high ranking does not come as a surprise as it has a lot going for it: a massive brand; a good quality video; and, of course, a horse. What was missing, however, was any sort of content or interaction with the actual game.

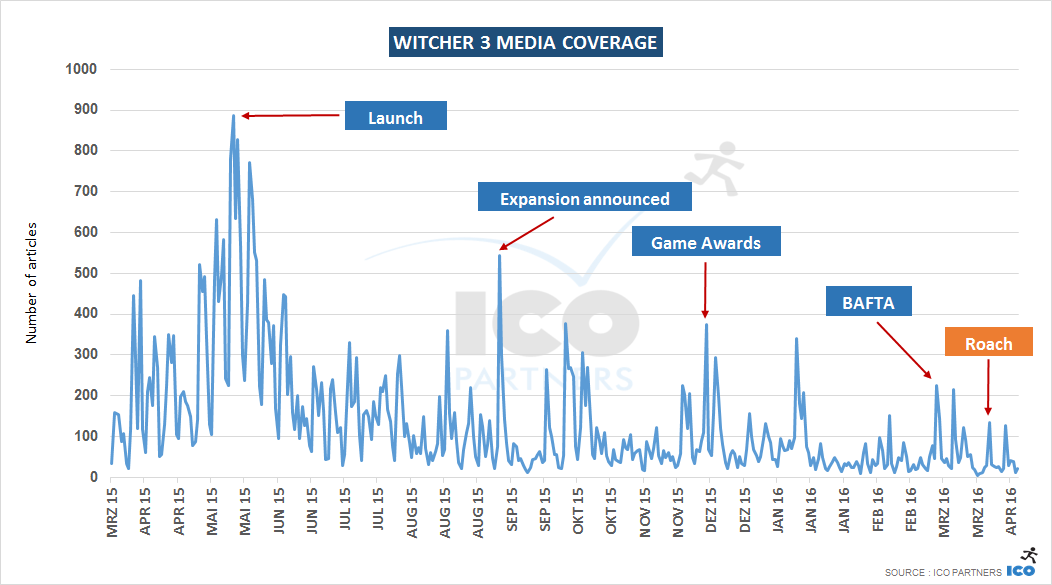
So by general metrics the Roach video was a huge success. Comparing the Witcher to its own high standards, it becomes clear that the April fool’s joke wasn’t strongly picked up by press compared to other Witcher news beats from the last year as illustrated in the graph below. Sure, it caused a decent bump in coverage, but compared to other  Witcher news beats, it wasn’t as impressive.

witcher_coverage

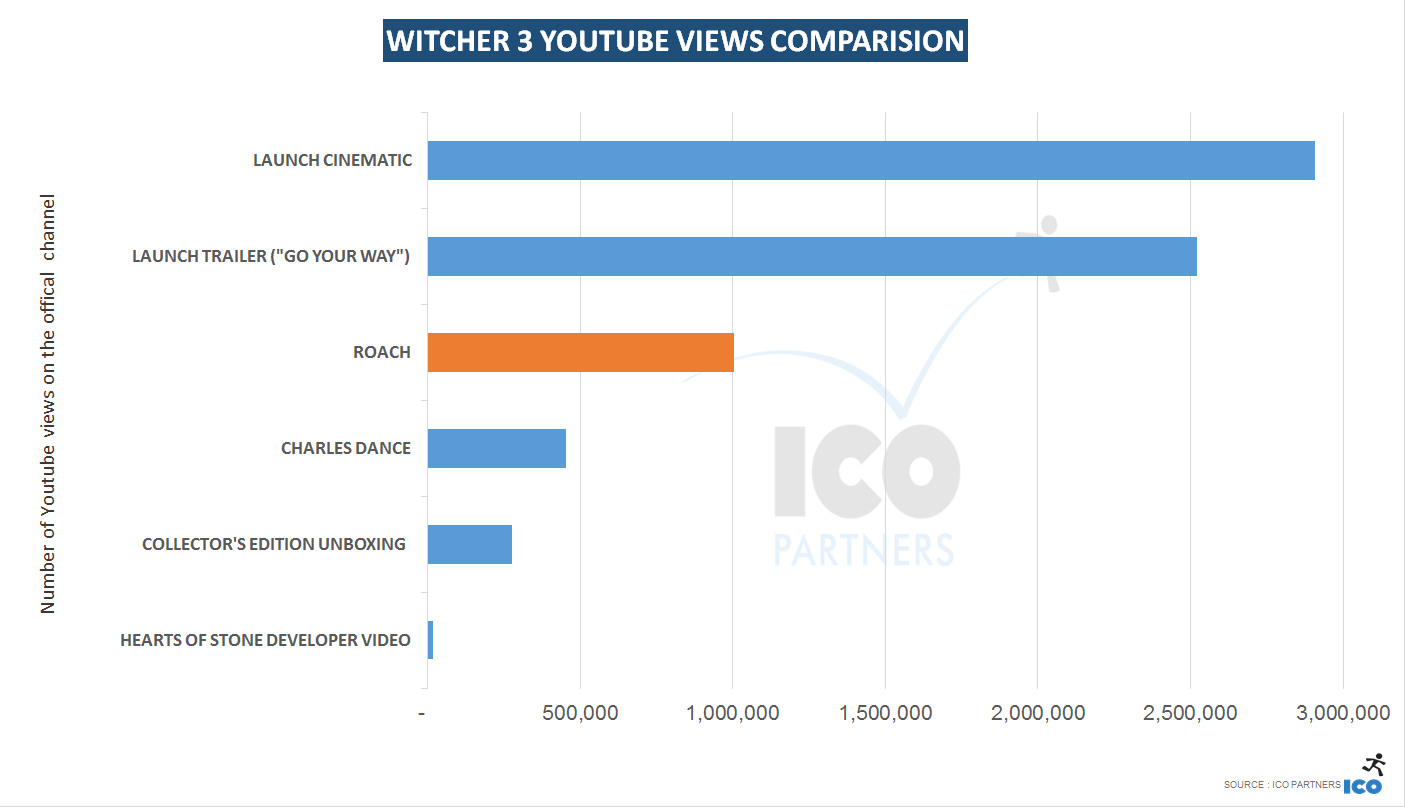
Through looking at the Witcher’s YouTube channel however, it seems that CD Project Red had more success in reaching its YouTube audience with the April Fools’ joke. The video hit a little over a million views, which is pretty much exactly the average view count across all videos on the channel. The video also seemed to have resonated with the audience as 99% of the over 30,00 YouTube ratings were positive. It also got more views than for example a video of the unboxing of the special edition or a making of video featuring Charles Dance (Dad Lannister from Game of Thrones).

witcher_3_youtube


Case Study 2
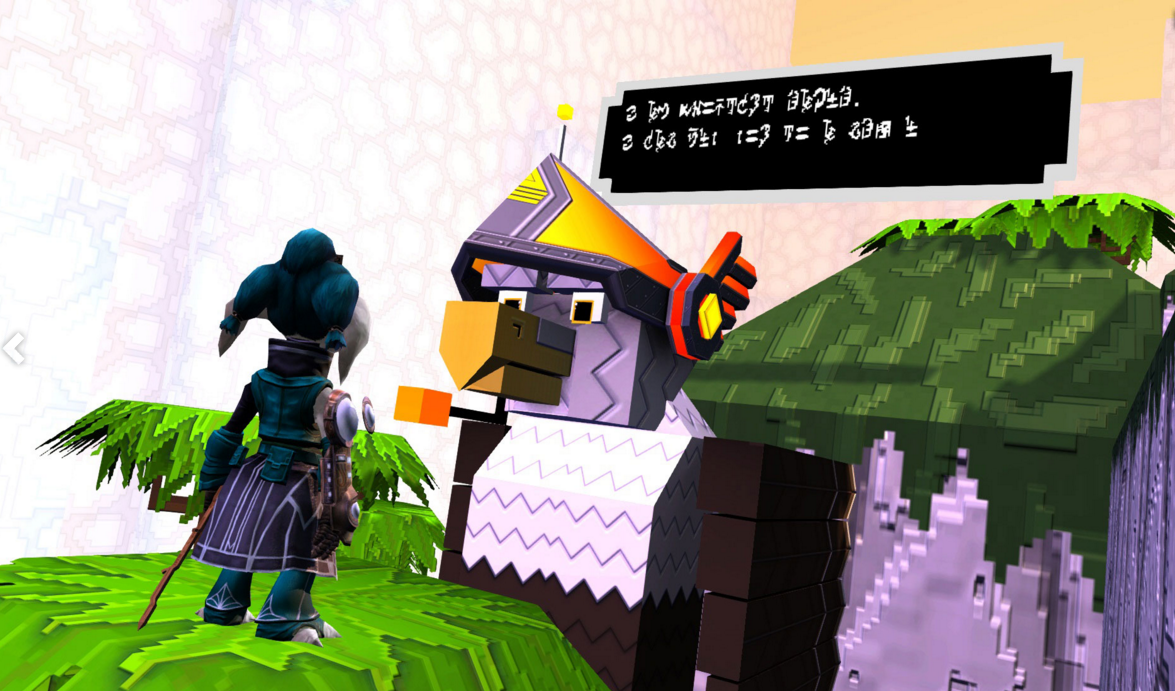
Clustertruck with “SUPER TRUCK”

If you follow my Twitter you will know I’m a big fan of tinybuild’s unconventional and often clever PR stunts. For April fool’s they managed to pull of an impressive joke for their game Clustertruck called SUPER TRUCK.

Not only does the April fool’s joke come with a high quality video, it also plays on Super Hot and perfectly capitalizes on the high profile of the indie hit. In addition, the joke offered a playable version of SUPER TRUCK that repackages and promotes the gameplay of the upcoming actual game Clustertruck

clustertruck_youtube

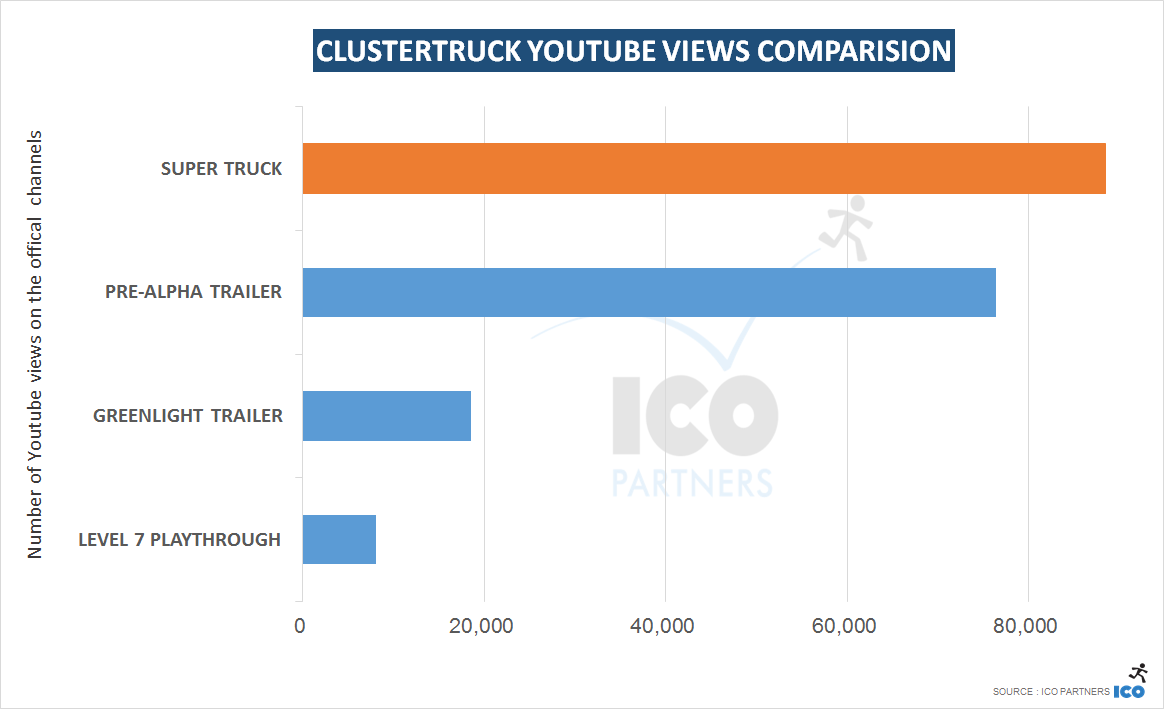
The video alone managed to get 88.420 views on tinybuilds official YouTube channel. None of the other Clustertruck videos from developer Landfill Game’s reached such a high viewing number.

Another very positive side effect of a playable April Fools’ joke is buzz from YouTubers. Just from a quick search of the first page of YouTube search results for “SUPER TRUCK” we spotted over 2 million additional views from additional Let’s Plays. A nice benefit that others – for example The Witcher’s Roach or the Hearthstone MMO – missed out on.

clustertruck_coverage

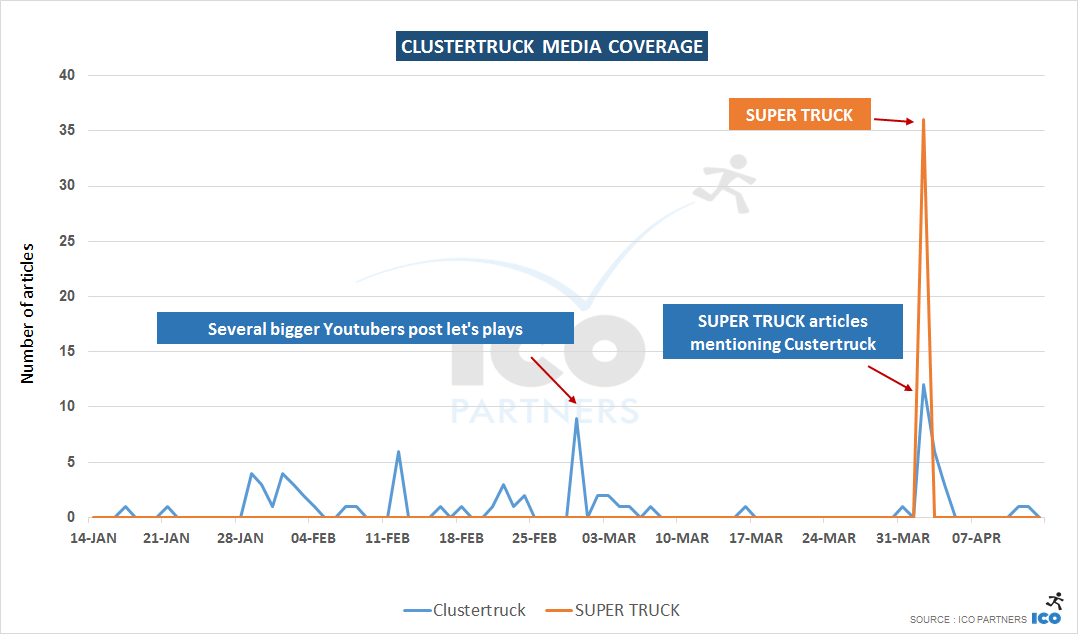
Media coverage also turned out to be great for a relatively low profile game like Clustertruck, resulting in the biggest PR beat for the game until now.  That being said, SUPER TRUCK alone generated nearly three times the amount of articles than articles about the April Fools’ joke that also mention the actual game Clustertruck, which might be both positive and negative. On the one hand, the lack of a clear and visible link between the two games may have resulted in the April Fool’s stunt looking less like a promotion, thus leading to more players’ interest. However, this doesn’t help Clustertruck as much as it could have in terms of brand awareness.

Either way, the joke is the biggest PR topic for Clustertruck so far and shows that with the right idea, a good asset, and something playable, an April fools has the potential to be a great PR booster for both press and YouTubers alike.


Case Study 3
Guild Wars 2 with “Super Adventure Box”

guild_wars_april

Guild Wars 2 has a tradition for April fool’s jokes of adding retro looking levels to the game. This years Super Adventure box missed a video (which was a bit of a shame in my opinion) but the actual new content in the game generated a very good amount of articles for the online game.

guild_wars_coverage

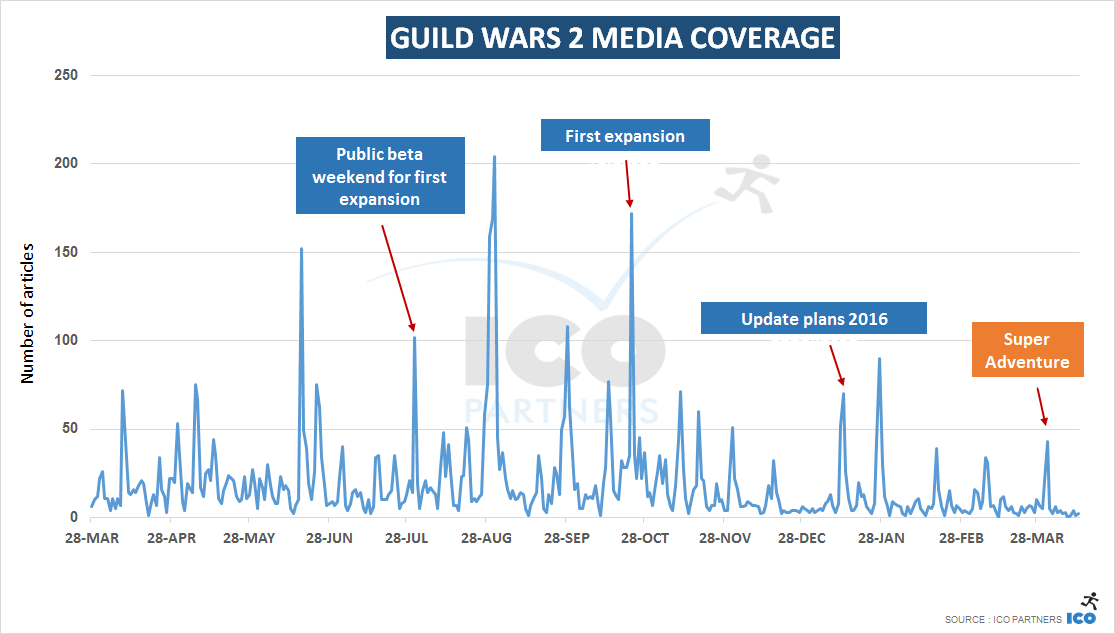
Looking at Guild Wars 2 coverage from the last year it is clear that the game has been out for a while and it is getting a bit quieter around the title. However, the in-game event managed to generate a nice media bump for the title that would have had most likely far less media impact if it wouldn’t have been placed on 1 April.


Case Study 4
Rocket League with “Ragequit Bot”

Update: The Rocket League team have been in touch with and clarified this year’s April Fool’s prank was – unlike the assumption made by us and several other news outlets – not actually made by them, but rather a community site. Apologies for the misunderstanding to the Rocket League team and congratulations to the Rocket League Garage team. To my knowledge this is one of the few times a fan made April Fool’s joke has made it into several prank round-ups from gaming websites. April Fool is on us I guess!

As mentioned above, getting media attention for an April Fools joke is no doubt easier with a bigger brand. However, our final case study, Rocket League, demonstrated clearly that even a huge name does not guarantee media attention. Rocket League’s video seemed a bit rushed, not very well thought-out, and most importantly not very funny.

rocket_league_coverage

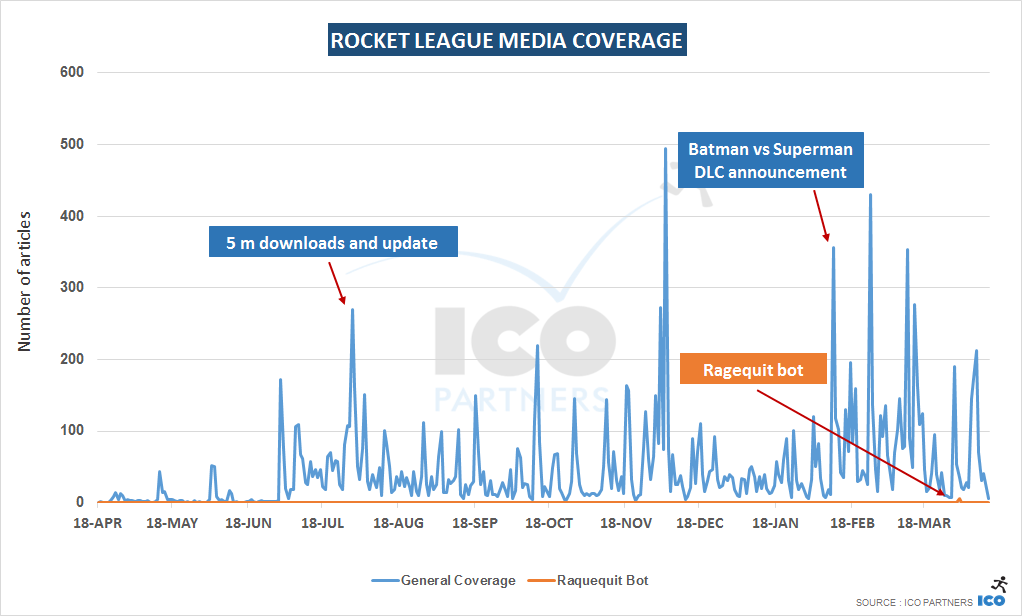
That is also reflected in the media coverage for the trailer,  which hovered somewhere in the single to low double digit numbers, whereas more successful news beats for the game generated several hundred articles. As Rocket League was also featured on several other topics that day, the low performance of the Ragequit bot video is not very apparent in the coverage graph above. To make it more visible, we decided to display it in a separate line in the graph.

rocket_league_youtube

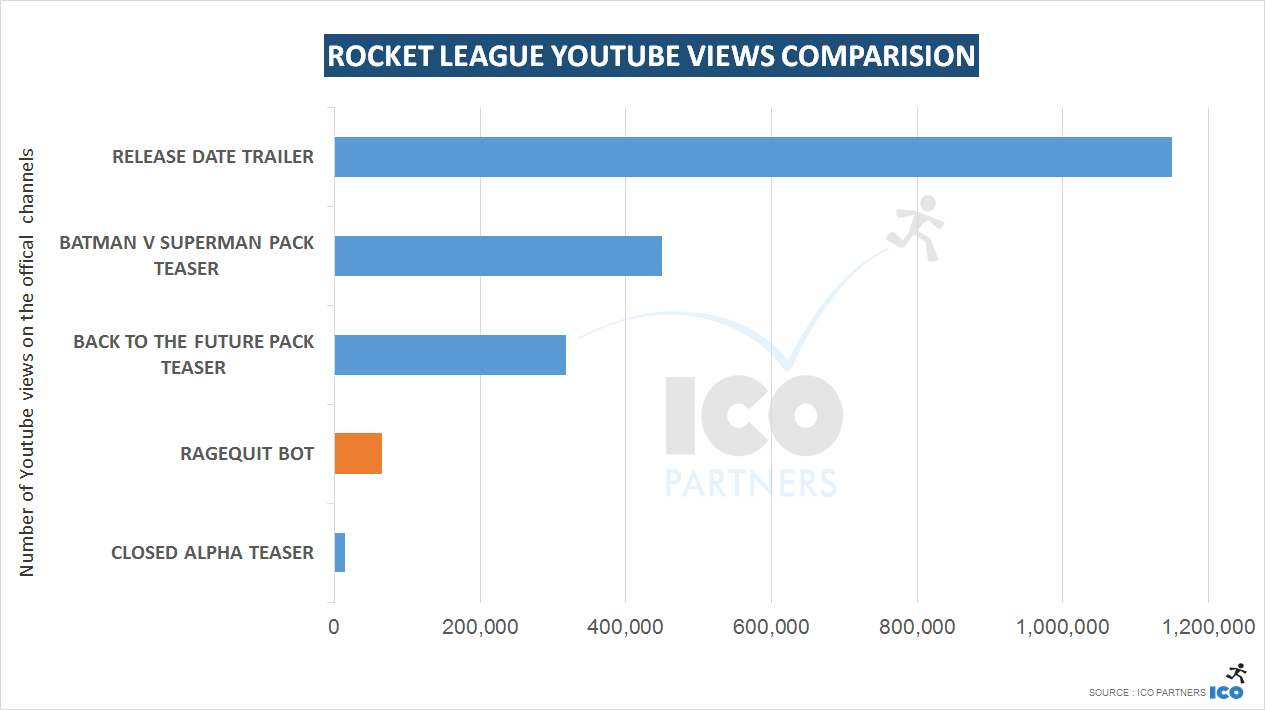
On the YouTube front, the video didn’t generate great viewing numbers for the Rocket League community. It should be pointed out however that the video was not featured on the main YouTube channel of Rocket League, but instead on a community channel.

On average a video on the Rocket League main channel gets 173.613 views, and the community channel 115.404 views; the Ragequit Bot only managed to get 64.254 views, meaning that it under-performed in direct comparison.


The five golden rules of April fool’s jokes

To conclude, we wrote up five rules to keep in mind if you try to run an April fool’s joke next year.

  1. Stick to joke that are obviously jokes – even an idiot can see it is not serious…
  2. … but even if taken seriously, then make sure the announcement can’t be seen as a negative.
  3. If you don’t have good ideas, don’t do a prank announcement. Better nothing than something lame.
  4. Announce your prank before 12:00 pm. Late jokes seem out of place and miss round up featuring.
  5. If you manage to have something that is playable, do it. It works for Let’s Plays videos, it can get you tons of extra views; but it will get better effect overall.


2016 April pranks featured in this article

VR dominates the headlines, PlayStation beats Xbox and less but better coverage for the event

Like last year, I have put together a quick summary of the media coverage the Game Developer Conference received. If you have a look at last year’s blog post, you will see the methodology for measuring events’ media coverage has evolved. For events, I am looking at the “Key 20 days”, standing for the 9 days prior to the events and the 11 days from the beginning of the event. For topics, like last year, we look at the coverage for the whole week, from Sunday to Sunday that specifically mentioned the event.

GDC 2016: Fewer articles but higher profile coverage

For anyone attending, this year was a really impressive GDC. The halls were busy right from the beginning of the week and this is the first time since I have been attending the event (about 15 years out of 30 years of its existence) that I saw sessions showing as being full on the Monday.

Surprisingly, the official press release after the event that shows attendance numbers, announced the event has only grown from  “more than 26,000 visitors” to “more than 27,000 visitors“.

Where does GDC 2016 stand from a media coverage perspective though?

001-gdc_articles

There has been a slight decline in the number of articles mentioning GDC this year. It still saw more media coverage than 2 years ago though, and this is a significant amount of media attention for a professional event.

The fact is, even more than other comparable events, GDC media coverage is very dependent on the profile of the announcements made during the week and there are no staple press conferences like the ones at E3 or gamescom. Last year’s HTC Vive reveal, or the Unreal and Unity shifts of business models announcements might be at play here? The single biggest news in this 2016 edition was the Playstation VR’s price point though, but more on this later.

002-gameevents_articles

* Just a reminder that E3 is missing due to technical limitations with our tools.

The GDC stays in the same range of media coverage as the Playstation Experience or the Paris Games Week (the one with the Sony Press Conference).

However, there is one metric on which it stays ahead.

I have mentioned in the past, we give different media outlets a score based on their Alexa ranking. The better the ranking, the higher the score, up to a maximum of 10. This score doesn’t feature very often in the blog post as it is not always relevant and I also try to keep things simple (even if sometimes I fail despite various experiments over on Twitter).

The following graph shows the average score for the articles covering different game events. It is quite telling.

003-gameevents_averagescore

With the exception of the Playstation Experience 2015, the GDC is standing head and shoulders above the other events in terms of the profile of the media covering it. More articles are written that mention GDC from large websites than any other event, and this might be stemming from the professional dimension of the event.

Games engines media coverage comparison

More than any other event, GDC sees more announcements related to game engines and professional software and it is always interesting to see which one is coming on top each edition.

004-gdc_engines

This year was light on announcement around game engines, especially compared to last year. Crytek’s “Pay what you want” communication being the one standing out once the dust settled, but it still didn’t rock the world the way Unreal’s communication last year did.

Virtual Reality wins GDC

While it seems the decline in media coverage from last year could be explained purely by the fewer articles on game engine, it is time to address the biggest topic of this year’s GDC.

And while I wrote this right after the event, it is interesting to see that the general feeling that Virtual Reality took over this year edition is not just an impression:

005-gdc_vr

No question about it, between the eminent release of the Rift, and the Playstation VR announcements, there has been a lot of media coverage for Virtual Reality the week of GDC.

Virtual Reality was such a big topic that of the articles that mention GDC, a significant portion of them were about VR:

tweet_VRandGDC

In those five days, 28% of articles mentioning GDC are about VR. On the 16th of March, the day with the most articles related to the GDC, 38% of those articles mention VR.  Even on the 17th of March, where VR is only in 17% of GDC articles, it was the dominant topic.

Platforms comparison – A strong year for Sony and PlayStation

Looking at the evolution from one year to another in regards to the platforms and their coverage during the GDC week.

006-gdc_platforms

Things have stayed more or less at the same level for Xbox. There was quite a bit of news from Microsoft though, between the announcement they would open their platform for crossplay and the doubling down on the ID@Xbox commitment.

Playstation obviously is surfing on the Playstation VR wave, and probably has a few more things related to this up its sleeve for E3.

Leading up to June, it will be interesting to see how much Sony builds up on the momentum that the VR hype has created.

We are hiring!

Here at ICO Partners,  we’re looking for an experienced native English PR executive with equal amounts of writing skill, creative flair and love of video games. Prior PR/marketing experience is required, but the role could also suit someone with a different background in online communications, like a community or social media manager.

In case you didn’t know, we are based in the South of England, in sunny Brighton, a lively seaside city just one hour from central London by train. Our PR work deals mostly with online games (current projects include SMITE, Paladins and Fractured Space) as well as indie titles (such as 2Dark, Endless games and Fragments of Him).

If this sounds like you, and you’re interested in joining a small, fun-loving (but hard-working) team, please send your CV to jobs@icopartners.com and/or drop us a line for more info.

Here’s the job spec:

________

Who we are: ICO Partners Ltd., a small but growing online games services consultancy and PR agency based in Brighton, UK. Find out all about us at www.icomedia.eu.

Who we need: A flexible, experienced and motivated communications professional with a passion for video games.

Skills and requirements:

  • Native English speaker with very strong spoken and written communication skills
  • Minimum 3 years of experience in a position involving direct contact with the media
  • A background in PR, journalism, social media or community management is desirable
  • Deep understanding of the UK and English game media and industry
  • Proven organisational and planning skills, including PR planning and strategy
  • Self-motivated approach to work; ability to work to short deadlines and under pressure
  • Ability to work with and analyse data, as well as report writing
  • Experience working in multicultural teams and across languages
  • Additional language skills are a plus
  • Skills and experience in online marketing or social media is a strong plus
  • And last, but not least – A genuine experience and passion for video games

Responsibilities:

  • Managing relationships with journalists across selected European territories with primary care for English media.
  • Working closely with clients to create and implement PR plans, schedules and communications
  • Drafting press releases and media alerts
  • Developing and updating media lists and contact databases
  • Participating in daily media relations tasks, including media outreach, collection and analysis of press coverage, reporting, organization of events, interviews and promotions
  • Assisting with market research projects
  • Participating in product testing as required

Remuneration : TBD

Location:  Brighton, UK
Reports to:  PR manager
Hours:  Full-time, 37.5 hours per week

Contact:  jobs@icopartners.com

As promised, this is the second part of me looking at the past year and Kickstarter, this time looking at games and only games. It might help for a more general context to have a read of the previous post on Kickstarter as a whole for last year. Like in that article, you can find a fairly substantial deck with slides at the end for you to look at all sorts of numbers on that category.

The Games category

Overall, last year was really a good year for games on Kickstarter. As we saw, it was one of the 3 categories that really pushed the growth of the platform.

31-ks_games_2015_USD_pledged

32-ks_games_2015_USD_raised


From a financial point-of-view, the Games category raised 78% more money than in 2014. And even compared to the previous record, 2013, this is a 30% increase. All around, a very strong year in that regard.


36-ks_games_2015_fundedratio

What is also very good is that the total number of projects that got funded is also increasing. The growth is of 14% from the previous year. The total number of projects itself is growing much faster, but again, that’s in line with the trend across the board on the platform, and the fact that the growth of funded projects doesn’t follow at the same pace is not necessarily a bad thing – the quality of projects is not necessarily there to justify it.


35-ks_games_2015_USDraised_pertier_b

It is also an healthy sign that the financial growth happens across the tiers. It is easy for a few very large projects to carry that growth all by themselves, and while they obviously play a big role, they aren’t the only reason.

The only Tier that stayed flat is the $100k-$500k one, which is also the only tier with fewer projects than the previous year:

34-ks_games_2015_fundedprojects_pertier_c

I am going to look at the subcategories more in detailes. I have decided to do this in 3 parts, following the size they all represent:

37-ks_games_2015_subcategories_moneyUSD

38-ks_games_2015_subcategories_fundedprojects

I will do a quick overview on Games (the generic subcategory), Gaming Hardware, Live Games, Mobile Games, Playing Cards and Puzzles, before delving in Tabletop Games and Video Games, each one having its own part.

Smaller subcategories

The struggles of Mobile gaming

The Games, Gaming Hardware, Live Games, Mobile Games, Playing Cards and Puzzles subcategories, all taken together, represent 497 funded projects for last year, and $7.5m raised. That’s 22% of all the Games category funded projects and 5.5% of the money raised there.

It doesn’t mean those subcategories are not interesting, there are many things happening around them still.

The Games subcategory is a bit of pot-pourri, gathering all the odd projects that the other subcategories didn’t represent properly, in the mind of the creator. There are a surprisingly high number of Pen & Paper roleplaying games in there, despite being usually associated with Tabletop Games. There is not much to say on the trends in that regard. It seems that the addition of more subcategories that happened in 2014 has reduced the number of “orphan” projects that were ending there.

Gaming Hardware is very interesting. When it was added in 2014, Kickstarter retroactively applied it to a few projects, including the OUYA and the Oculus Rift. leading to this:

40-ks_games_2015_hardware_usdraised

41-ks_games_2015_hardware_projectspertier

There hasn’t be a “homerun” gaming hardware in quite a while. Still, 5 projects last year managed to raise between $100k and $500k, led by the FOVE VR device. This is a niche, and I suspect a number of creators actually choose to list projects that could fit here in the Technology category.

The Live Games section is also very niche, serving the LARP community with its own subcategory. The largest project to date (with still 17 days to go) is the revival of the Mind’s Eye Theater for Werewolf and sits currently at $76,000. I can see this growing over time, while still being niche. This is the type of projects that can be very local and community driven and I am not sure many people are aware that more LARP related project are actually being crowdfunded:

42-ks_games_2015_livegames_projects

I noted that the 3rd currency for Live Games is the Swedish Crown, behind the US dollar and the British Pound. LARP is strong up North I hear.

One of the first question to people coming to me with a video game project is “Is it a Mobile Game?”. Those games don’t get funded the way PC or Console games get funded and still many people aren’t aware of this. This is a very small category. First, very few of them get funded:

43-ks_games_2015_mobile_projects

Then, the ones that do get funded, few raise a significant amount of money:

43-ks_games_2015_mobile_raisedpertier

In itself, this is fine, but I think this is often something that people are just not aware, and they try to fund project of a scale comparable to the PC video games projects they see mentioned in the media.

The Playing Cards subcategory is the largest of those small ones. For a long time now, creators have been offering customized playing cards games on all sorts of popular art style or intellectual properties (especially when a company like Bicycle makes it particularly easy to manufacture them). It made sense for Kickstarter to add this as a subcategory, and this is a thriving one:

44-ks_games_2015_cards_raised

There is also an interesting spread across the different sizes of projects:

44-ks_games_2015_cards_projectstiers

Finally, Puzzles is a very niche segment overall. We are talking 15 projects funded last year, the same as in 2014. None of those raising more than $50,000.

Tabletop Games

2015 is the best year across the board

It seems fair to say that board games are doing incredibly well on Kickstarter. I would love to see some industry-wide numbers, but I wouldn’t be surprised if crowdfunding was a notable portion of those.

45-ks_games_2015_tabletop_usdraised

46-ks_games_2015_tabletop_projectsratio

So, not only 2015 was a great year financially, with a significant growth from 2014, but also the best year to date, it was also a good year for the total number of projects that got funded. also an all time high and in constant growth since the launch of the platform.

47-ks_games_2015_tabletop_usdraisedpertier

Again, looking at the amount of money raised for each “tier” of project, this is a very healthy trend: there has been more money across all the tiers. the large projects weigh heavily, but that doesn’t mean we have an issue of a growth happening only from the top.

47-ks_games_2015_tabletop_projectspertier

Doubling on the previous statement, more projects got funded on all tiers.

48-ks_games_2015_tabletop_projectpercurrency

There are many stories that projects need to be released in USD on Kickstarter to get funded. And while there is a high ratio of funded project there, I suspect the rumours are pushing a confirmation bias.

Well, actually, projects in GBP have a higher success rate. Good job on the British tabletop industry!

47-ks_games_2015_tabletop_0usdratio49-ks_games_2015_tabletop_projectsuspended

Trying to find anything to compensate those excellent trends, I wanted to share the ratio of $0 projects (my junk ratio) and the number of projects that got suspended by Kickstarter. In both cases, the tabletop subcategory is actually performing very well.

2015, officially the best year ever for boardgames on Kickstarter.

Video Games

Maturation means more money, but not for more people

I suspect the main interest for many of you, the Video Games subcategory had a good year in 2015, financially:

50-ks_games_2015_videogames_usdraised

But looking at the number of projects funded, it is clear the good performance was driven by large projects:

50-ks_games_2015_videogames_projectsratio

This is the 2nd year in a row that we see fewer projects being funded on Kickstarter. There is no sharp drop, so this well be the system being refined and the communities being more demanding in terms of quality before funding projects.

51-ks_games_2015_videogames_usdpertier

52-ks_games_2015_videogames_projectspertier

The range of projects that are less common from 2014 are the $10k-$50k and the $50k-$100k ones. We keep seeing a growth of the very small projects, year-on-year, though.

There are more projects than ever trying their hand at getting funded on the platform though. I suspect the quality bar to get funded is just getting higher. For most projects, it now necessary to have a demo of the game already available and the ability to show a rather advanced stage of the development process, much more so than in 2013. The fact is also that video games projects don’t scale the way board games to. The average for a funded Video Games project is $43,000 while  the average goal for a funded Tabletop Games project is $9,700. There are many differences in the way both medium are built and developed and the ecosystem in which they evolve that mean that they will always behave differently as far as crowdfunding is concerned.

Now, last year, Kickstarter opened up to many important European countries, including Framce, Germany and Spain. And while it help with the growth, it was rather disappointing:54-ks_games_2015_videogames_usd-percurrency_b

54-ks_games_2015_videogames_projects-percurrency

Projects in EUR as their currency are ranked 4th, ex aequo with projects in Australian dollars. I would expect there is a significant margin of growth there.

Finally, I wanted to mention those two indicators as with the Tabletop games:


52-ks_games_2015_videogames_0usdratio

56-ks_games_2015_videogames_suspended

The junk ratio (proportion of projects that raised $0), while higher than the one for boardgames, is quite under the average you see on Kickstarter (20%). And even there has been a significant increase in the number of projects suspended by Kickstarter, overall the subcategory has not a massive amount of those.

As a conclusion, despite seeing a larger amount of money being raised for video games, I would put 2015 at the same level as 2014. There has been a small decline in the total number of projects being funded – no bubble bursting here IMHO – and opening up to more European countries didn’t have any significant effect for video games. Overall, it seems crowdfunding for games get a bit more sophisticated, increasing the bar for funding, while still being a very beneficial process for the few projects perfectly fit for the model, such as were Shenmue 3 and Bloodstained last year.


Parting words

To finish this blog post though, I wanted to share 3 projects, currently live now, each one quite original, all of them with an art direction I particularly appreciate, and that I hope you will find interesting.

If you do, you can back them of course, but more importantly share them around.


All the slides

While I might have missed the symbolical January window to post about the past year, this review of Kickstarter in 2015 in numbers will hopefully still be of interest to all of you. Like for the blog post I did last year, I have put together a massive PowerPoint deck with tons of numbers and details across all the different categories of projects on Kickstarter. Unlike last year, I won’t discuss the game category in depth in this blog post though. But don’t be disappointed, I will make a dedicate games post for this shortly.

Kickstarter has grown 35% in 2015

1-kickstarter_2015_total_USD_pledged

2-kickstarter_2015_total_USD_raised

In 2015, the total amount of money going to funded projects increased by 35%. That’s $160m more than in 2014. And if you wonder what that means for the platform, that’s an extra $8m, just for their 5% fee (there is an extra fee for the payment processing) for a total of $30m for the year.

Financially speaking, there are two ways to look at the size of Kickstarter projects. Kickstarter usually talks about money pledged, meaning the amount of money that was promised to projects, not considering if those projects reached their objective or not. The other way is to only look at the money that was promised to projects that reached their goal successfully.

Because of the nature of crowdfunding and the way people back, the difference between these two numbers is not huge. Almost 90% of the money pledged actually went through to projects meeting their goals.

3-kickstarter_2015_total_projects 4-kickstarter_2015_total_projects_successratio

Looking at the total number of projects, we get a more precise picture: Despite the significant growth, the total number of projects that were funded stayed about the same (we are actually talking about a 0.9% decline). This is the first time since the platform launch that this happened, making the impressive financial growth last year clearly related to an increase in the average money each projects raised.

The growth of total number of projects is significant though, meaning more creators are coming to Kickstarter to finance their projects, but this doesn’t translate in more projects getting funded.

If you are not familiar with the format I usually use, the following graphs are showing the break down of projects based on the amount they have raised (in USD).

6-kickstarter_2015_total_moneyraised_tiers

7-kickstarter_2015_total_fundedprojects_tiers

On the money raised, it has increased in all tiers except the lowest one (projects that raised under $10,000). Obviously the higher the tier, the more potential it has to raise more money, with no ceiling on the amount of money that can be raised by the higher tiers.

On the total number of projects per year, there is a decline for the under $10k tier, a negligible growth for projects between $10k and $50k, a significant increase for the projects between $50k and $500k, but more importantly, there were 75% more projects which raised more than $500k (from 80 to 140 projects).

8-kickstarter_2015_healthindicators

An incredibly interesting indicator is looking at the percentage of projects that raise $0. I call it the junk ratio and that might not be very kind, but it shows the proportion of projects that are so low quality, that nobody actually pledged on them. That means the person behind the project couldn’t convince their friends nor their family to at least pledge a little to show support.

We can see a form of gold rush coming to the platform, but it is probably a good thing this doesn’t translate in an increase of the number of projects getting funded. The wisdom of the crowd in action in a  way.

11-kickstarter_2014-2015_moneyraised_percategory

A lot of the growth of the past year happened thanks to projects in the design category, taking the number 1 spot in front of Technology and Games which are respectively 2nd and 3rd. Most of the other categories stayed at the same level they were in 2014.

12-kickstarter_2014-2015_moneyraised_percurrency 13-kickstarter_2015_projectsratio_percurrency

In 2015, Kickstarter expanded in many EUR countries, which saw a direct impact on the amount of projects and the money raised by projects in EUR. (Note: we can’t tell where the backers are from, those numbers are based on the currency the project is presented in)

EUR is 3rd currency on the amount of money raised, even if it is still 4th, behind Canadian dollars for the number of projects funded (despite more projects overall).

A look at the categories

Kickstarter asks creators to put their projects in different categories. This allows us to look at the different trends of each of those categories. While you can find a lot more details in the documents on Slideshare, I have summarized some key takeaways for each of them below.

Art

Bigger projects are becoming more common. In 2015, the number of projects in the $100k-$500k band doubled.

Crafts

A relatively small category, it has nearly doubled in a year. Woodworking is the single biggest subcategory outside of the generic Crafts one. Also, there is a Taxidermy subcategory.

Comics

2014 saw a significant drop in the money raised in this category.  Last year it bounced back to its highest ever (money and number of funded projects). About half the projects in the Comics category get funded.

Dance

2015 was the worst year since 2011 for this category, which is also the smallest on the platform, even though for the first time a project raised more than $100,000. The number of projects that raised between $10,000 and $100,000 dropped down by half in a year. Interestingly, this is a category that seems to be very popular in the UK (48 funded projects last year, out of 295 in total).

Design

I mentioned it at the beginning, 2015 was a big year for design projects. The category is the one that raised the most money in 2015 and it grew across all sizes of projects as well. Also notable, the projects in EUR are only second to projects in USD in total money raised in this category (GBP is still 2nd in the number of successful projects).

Fashion

This category is still growing steadily year-on-year. Notable though, the ratio of junk projects (projects that raised $0) is quite high at 28% (the average is 20% across all categories for 2015).

Also. There is a Pet Fashion subcategory.

Film & Video

Once the leading category of projects on the platform,  for the second year in a row it is seeing a decline, both on the amount of money raised and the number of projects funded, and this is across all ranges of projects. This doesn’t look like a bubble bursting though. Also interesting, this is a category that’s not showing a lot of projects in EUR. Like a couple of other categories, I suspect this type of very localized content is already quite strongly supported on other platforms that were present locally way before Kickstarter launched there. Finally, across the many subcategories, Documentary is the largest with 22% of the funded projects and 37% of the money raised.

Food

The Food category saw a small decrease from last year, but nothing incredibly drastic. The category is not incredibly popular on the EUR platform. Important thing I learned though: there is a Bacon subcategory.

Games

As mentioned previously, I plan on a whole blog post for this category. Interesting to note though, 2015 has been the best year ever for this category, both on the amount of money raised and the number of successfully projects, and the Tabletop Games subcategory is the largest by a significant margin.

Music

This category follows the same pattern as the Film & Video category: a slight decline for a 2nd year in a row) and EUR is the 4th currency. For the music genre, Country & Folk subcategory is #1 for money raised, and the Rock subcategory is #1 for funded projects.

Photo

The category saw a slight growth from 2014. However it is one of the categories with the largest ratio of junk projects, with 26% of the projects collecting $0.

Journalism

This is quite a small category (second to last), but it actually grew significantly from last year (+63% in money pledged). It is also the category with the largest proportion of junk project, with a third of all projects not raising a single dollar.

Publishing

While the category grew when you look at the money pledged to its projects, the number of funded projects actually declined slightly. It seems still fairly stable though. Like the Music and Film & Video categories though, EUR projects are representing a fairly small number of the money raised, being the 4th currency in amount of money pledged, just slightly more than projects in Australian Dollars. It has a fair share of junk projects with 25% of the projects at $0 pledged to them. The largest subcategories are Artbooks for the total amount of money raised and Children’s Books for the number of funded projects.

Technology

The second largest category on the platform, Technology grew in the past year both on the number of funded projects and the total amount of money pledged to its projects. There were about as many funded projects in that category using the EUR as their currency, as they were using GBP.

Theater

A fairly small category, it has declined last year to its lowest since 2011. Very interesting to note that it is incredibly strong in the UK with more than a third of the funded projects being in GBP.


All the slides

A note on the methodology

Like for all previous blog posts on the topic, we have been using the data on the Kickstarter pages themselves (with the help of Potion of Wit) and the collection method is not without its own issues. Please consider all of the numbers presented here as estimates.

BUT. I would like to point everyone to this blog post from Kickstarter. In it, they present the successes of 2015 in the Game category and a few numbers. Our own numbers are incredibly close: 2,259 funded projects (Kickstarter) / 2,258 funded projects (ICO); $144.4m pledged (Kickstarter) / $145.6m (ICO). I am very happy with those margins of error.

With 2015 behind us, and the new year already under way, it is time for the traditional year-in-review articles, and I don’t see any reason for us to avoid the trend. I went to Twitter to ask about what to tackle first, and the media overview won over a Kickstarter post (probably due to my recent article on GI.biz satisfying the need for the time being, but don’t worry, a Kickstarter related article will happen too).

As usual, if you are not familiar with the way the data is collected, I invite you to read the blog post on the topic.

Games

As a reminder, we mostly look at the top games for every single month. While this is not ideal, at least it provides some insights on what the top topics in the media are. I have selected a few games to look at in more detail to help give some sense of scale.

But to start things, here are the top 15 games that garnered the most media coverage in 2015:

games_top15_year_2015

First thing, please note the scale starts at 20,000 articles over the whole year. It is a bit deceiving, but it does make the  chart easier to read.

At the top, at a comparable amount of coverage, we have 3 different games:

  • The Witcher 3. An action RPG, historically a PC franchise, from a smaller publisher (smaller doesn’t mean small though) and that got a fantastic amount of coverage which I believe is mostly because of how good it is and how much its audience wanted to read about it. CD Project also managed the communication on the title very well, including after launch and with a strong and clever DLC strategy.
  • Fallout 4. I have talked a lot about Fallout 4 in the past already. The game got a huge amount of coverage, but is not the first on the list only because it was announced until we were already 5 months into the year.
  • Grand Theft Auto V. A game launched released in 2013, but the franchise is strong in the family (should have kept that one for the next game in the list, but hey). If you look at the key events for this game in the year, it was mostly the PC release. For a strong console franchise this is not considered key, but it seems there is a never-ending interest for the GTA games in the media.

Next in the line is Star Wars Battlefront, which did significantly well in terms of coverage. However, considering this is the comeback of a beloved name, a Star Wars game released close to the 7th Episode of the movie saga, and the Battlefield/DICE FPS of the holidays, it came to be expected that it would do well with the media.

A few other things I feel like pointing out:

  • Minecraft is a regular performer in the monthly media performance overview, and it is a game that is incredibly steady (few spikes, but few lows) and expected to be in this ranking. League of Legends, though, is rarely in the monthly Top 15 games, but is incredibly steady in the amount of media coverage it gets. While I expected the game to have a wider reach due to the final Worlds being in Europe (with events across different countries for about a month), it makes it one of the most presented game in online media in 2015.
  • There are 4 games in that list that are exclusives: Bloodborne (released in spring with less high profile competition and more time to gather coverage through the year), Halo 5 (the strongest Microsoft game franchise… after Minecraft), Rise of the Tomb Raider (an iconic, hall-of-famey franchise) and… Splatoon. Incredibly good media coverage for the Nintendo squid-shooter game, and again I believe the quality of the game resulted in its excellent media presence.

Highlighted games through 2015

game_SELEC_2015

In order to give some sense of the media coverage for games, I arbitrarily picked 5 games with fairly different patterns on the way they are covered. Right away, with this first comparison, we can see the difference in the scale of the coverage between 3 of the top 15 games in media coverage, and 2 indie games that were very well covered by media.

game_fallout_2015


Fallout 4 had a dream start at E3, getting record breaking coverage during the event. But the coverage it received on release, 16,000 articles in the month of November, is way, way more than the highest number of articles for a single game in a month. In 2014, the game with the most articles in a given month was Watch Dogs with close to 11,000 articles when it was released in May, with the close second GTA 5 with 9,600 articles in November, both of those performances being quite unique during the year. Here we have Fallout 4 with close to 50% more articles than the best of those performance in November. Truly a phenomenon.


game_minecraft_2015

I was talking about the steadiness of the Minecraft media coverage and I really wanted to show it off. There were never less than 2,000 articles per month and there was a nice flow of new releases, as well as the announcements of the support with new devices like the Oculus Rift and Microsoft’s Hololens for instance.

game_tombraider_2015

Rise of the Tomb Raider illustrates nicely the media cycle for a game as part of a big franchise. The game had been announced earlier in the previous year and before E3 had very few communications pushed by out by Square Enix and Crystal Dynamics. The February spike is coming from the one announcement in that period, about the fact the game would be released on the Xbox 360 as well.

Then E3 kicked in, the machine was in motion, steadily ramping up till the launch of the game in November.

game_goatsim_2015

I make no secret of my undying love for Goat Simulator and its incredibly efficient communication style. The DayZ parody DLC (even though I no longer know if this is still a parody with Goat Sim) in May was the height of the media coverage for the game, followed by the media coverage of the PS3/PS4 version of the game in August. It is interesting to see how the larger overall coverage observed for the different platforms is echoed here for Goat Simulator where, while released earlier on Xbox 360 and Xbox One (in April), it didn’t receive as many mentions in the media.


game_dontstarve_2015

Looking at the most important months in terms of coverage for Don’t Starve:

  • June saw two very large announcements with the release of Don’t Starve Together and Don’t Starve coming to Xbox One.
  • In December, Don’t Starve Shipwrecked was released in Early Access on Steam and Don’t Starve Together was featured at the PlayStation Experience.
  • May had the Wii U version of the game released.
  • April, July, August and November have a remarkably close amount of coverage which was (mostly) coming in respective order from the release of Invisible Inc. (where many media mentioned Klei as “The makers of Don’t Starve”), the Don’t Starve Pocket edition release, the announcement of Don’t Starve Shipwrecked, and the announcement of the release date of Don’t Starve Shipwrecked on Early Access.

More games data

Platforms

I won’t be looking at 2015 year month by month, but will rather mention a few things that happened that are worth highlighting before sharing slides with the monthly data for anyone who wants to dig into those in more detail.

What’s is interesting to note is that looking at the whole year, there are big differences in the global coverage across the different platforms.

platforms_articles_2015b

The PlayStation brand is having a very strong lead over Xbox, with 66% more articles taken over the whole period. The brand not only has more usage (PlayStation 3, PlayStation 4, PlayStation Vita, PlayStation VR) but also leads across products in a similar generation, with PlayStation 4 for instance having 35% more mentions in the media than the Xbox One.

Worth noting is that at the end of the year, mobile platforms are neck and neck in terms of coverage. The media samples we use are not heavily geared towards tech websites though, and it might be a totally different story if they were. We mostly have websites covering the game side of mobile (and sometimes also other news in that space), but regardless it is a very interesting outcome.

The Nintendo brands are very much behind the other consoles. This is not necessarily very surprising as there is a strong correlation between the number of title releases each console see every year, and Nintendo consoles don’t have as many title launches. Looking at the monthly data, Nintendo is also very much behind the curve on the media coverage.

PlayStation and Xbox

playstation_monthly_articles_2015

xbox_monthly_articles_2015 xboxvps_monthly_articles_2015

Unsurprisingly, the biggest month for the media coverage was E3. We have seen in the past that it is the event in the year that has the biggest media impact. Interestingly, March is next for both platforms. That month sees a lot of game releases, and I suspect a harder push on the media side because of  the fiscal year ending. Events such as GDC and PAX East, while having some effect, are not covered enough to be the reason behind the March spike. September is the third biggest month for PlayStation; it sees the double effect of the first wave of the year-end releases and the Tokyo Game Show.

Of course, we can see the outcome of Microsoft being the only platform holder with a media conference at gamescom. It is the one month in the year where they clearly close the gap with Sony’s console, even if they don’t necessarily reach the same level.

Finally, the steady performance of the PlayStation over the last quarter is quite remarkable. A steady release of AAA games helps, but the positive effect of the PlayStation Experience on the media coverage is tremendous and the one reason that December, an otherwise slow month for the other platforms, is one of the strongest for Son – right in time for Christmas.

I think the competitors should take a page from Sony’s playbook on this.

Oculus

While I plan to delve further into VR in the media later this year, it is interesting to have a look at Oculus specifically. We are still far from the media coverage the large game platforms have, but this is still quite significant.

oculus_monthly_articles_2015

A lot of the Oculus media coverage is lead by announcements and events. June 2015 had the Oculus media event the week before E3, as well as coverage from the VR company’s presence at E3. May 2015 saw the announcement of the release of the commercial version for 2016, and while expected, this had been a confirmation as there were still discussions of the device being a Christmas 2015 release. September 2015 was when the Oculus Connect 2 event happened, and even while this is a developer event and the device not being available yet, it is a strong platform for announcements such as Minecraft coming to the Oculus Rift. Interestingly, December 2015 saw a more incremental build-up from multiple beats during the month, even if the Games Awards announcement (Guitar Hero VR leading the charge) had a strong effect there too.

Even though I was expecting to see a growth from last year (there were almost 30,000 articles in 2014, with at least 1,500 articles just on the Facebook acquisition of the company though), all in all, this is a decent point to build up from and we shall see how much VR will evolve in 2016 as the first time when you can actually buy the first commercial headset. Personally, I can’t wait to get our CV version that we will receive as Kickstarter backers.

More platforms data…