It has already been six months since my last check on the crowdfunding trends for video games. With everyone taking it slow because the summer is coming (I am joking, everyone is rabidly preparing for gamescom), here is the latest data and what I make of it. This is part one, as I will do another blog post on Tabletop Games. Read more
As is the tradition, this is the follow-up from the overall Kickstarter annual review from last week, with a focus on the Games category. Again, I will talk about Kickstarter, but I shared some insight on crowdfunding across different platforms for video games in a piece on PC Games Insider.
Games category now leading on Kickstarter
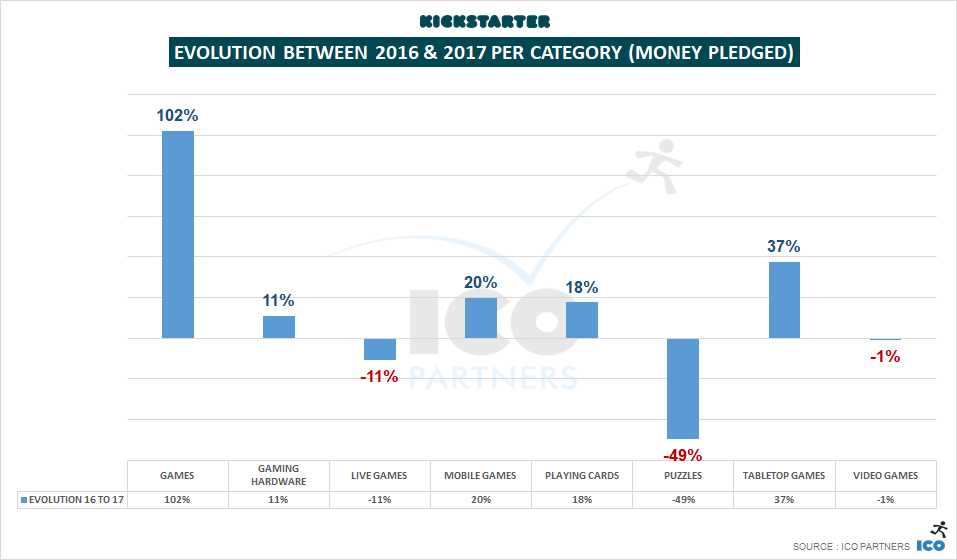
We talked about it last week, but that’s a notable change from 2016. Games represented 26% of all the money pledged in 2017, and 15% of all the funded projects.
There are two very important things to notice here.
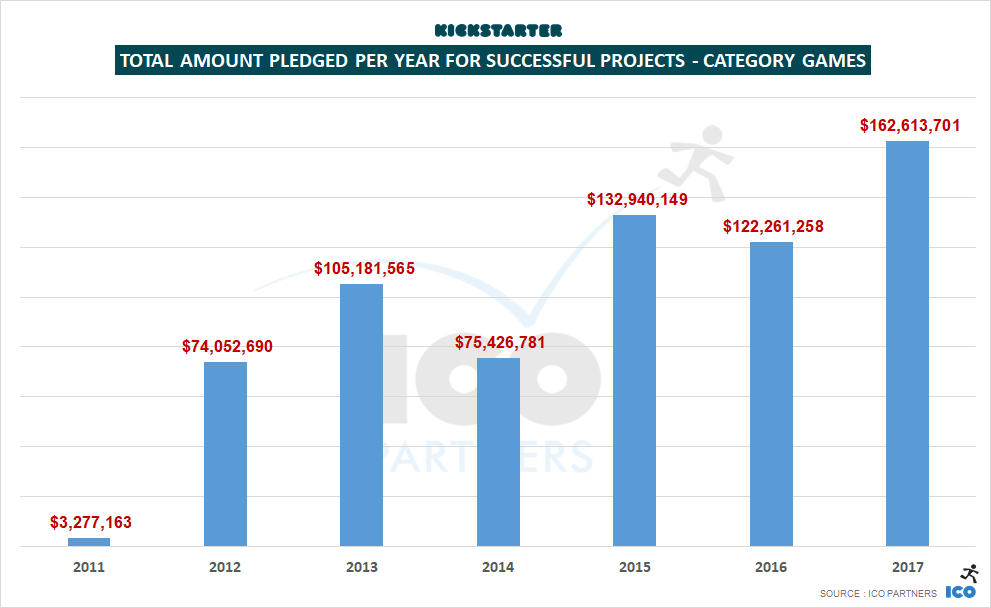
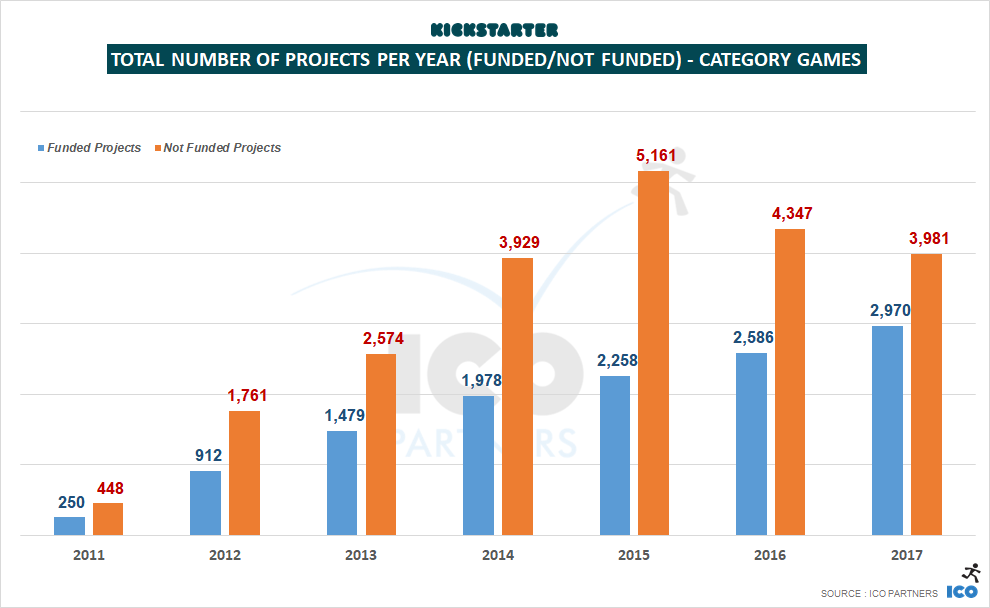
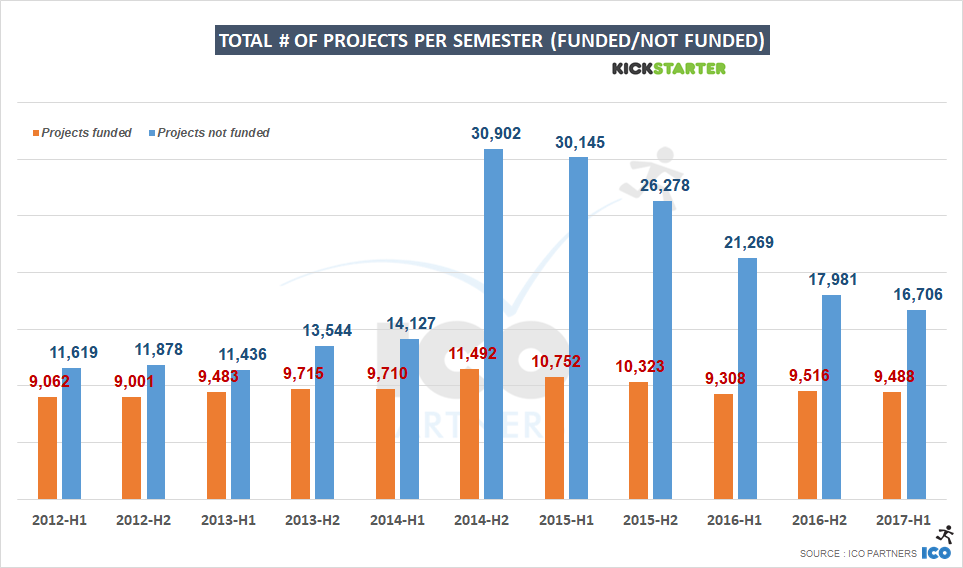
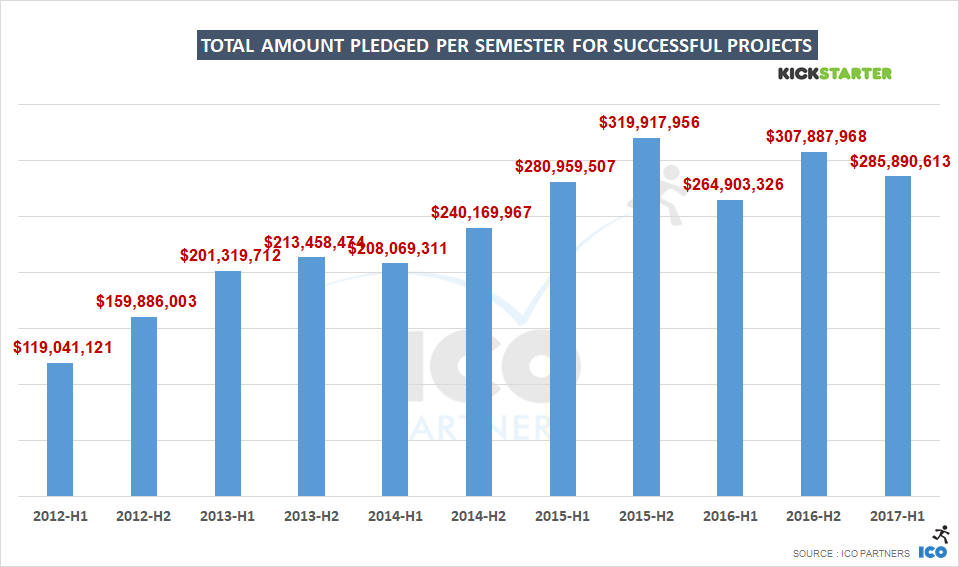
First, the overall money raised by Games projects saw a significant bump in 2017. Secondly, the total number of Games projects that tried their luck on the platform has stayed roughly the same, at just under 7,000 campaigns total, but more of them achieved their funding targets in 2017, compared to the previous year.
We can consider that the platform has reached a better maturity point, where the projects trying to get funded having a better sense of what is required to meet their funding goal. There were 15% more Games projects funded in 2017, compared to 2016.
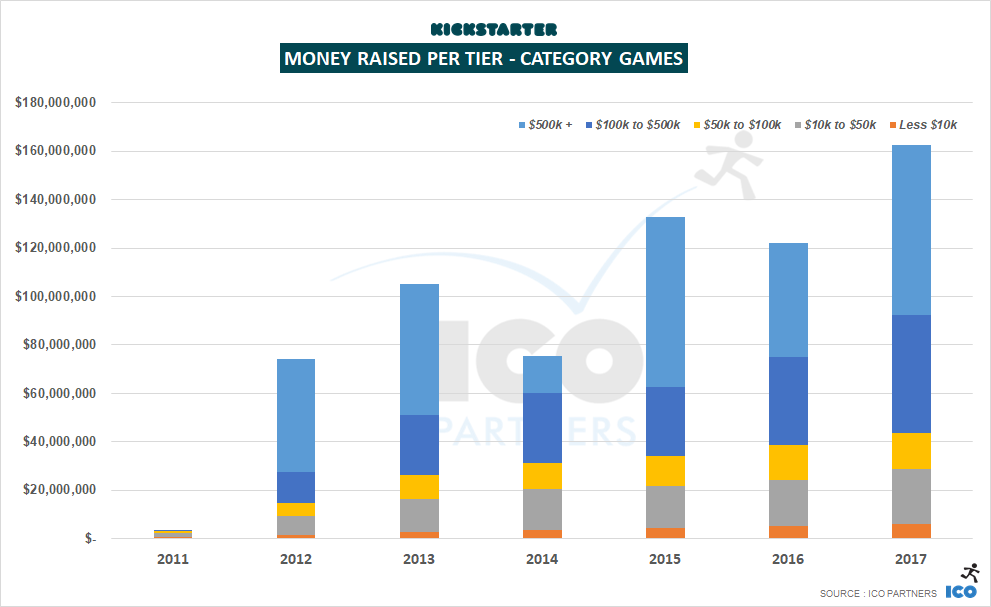
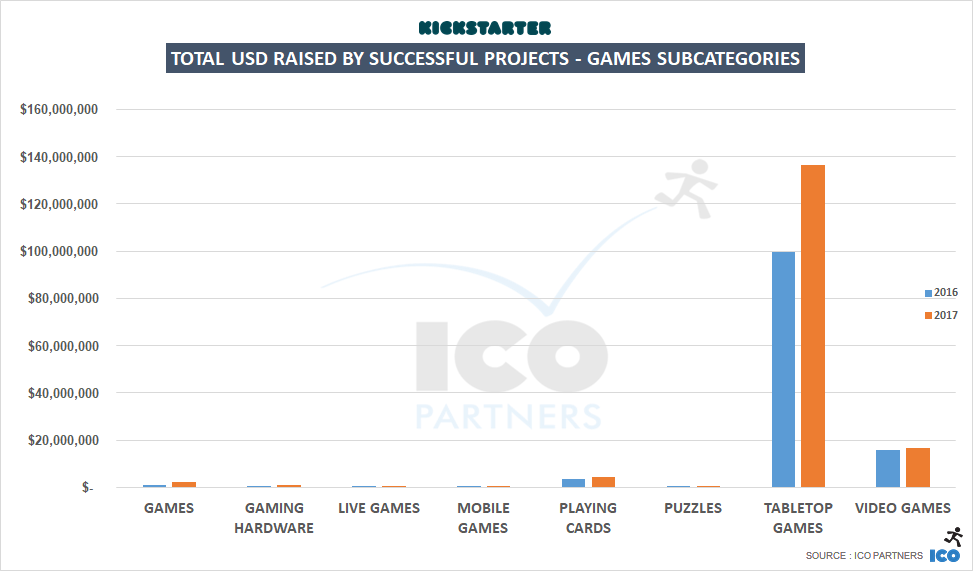
More money was raised all projects tiers. The top-tier, $500k+ projects represent a lot of the total money raised, of course – there was $70m raised by these projects alone. But the number of projects successfully raising between $100k and $500K is also up on previous years, representing about a third of all the money raised in 2017.
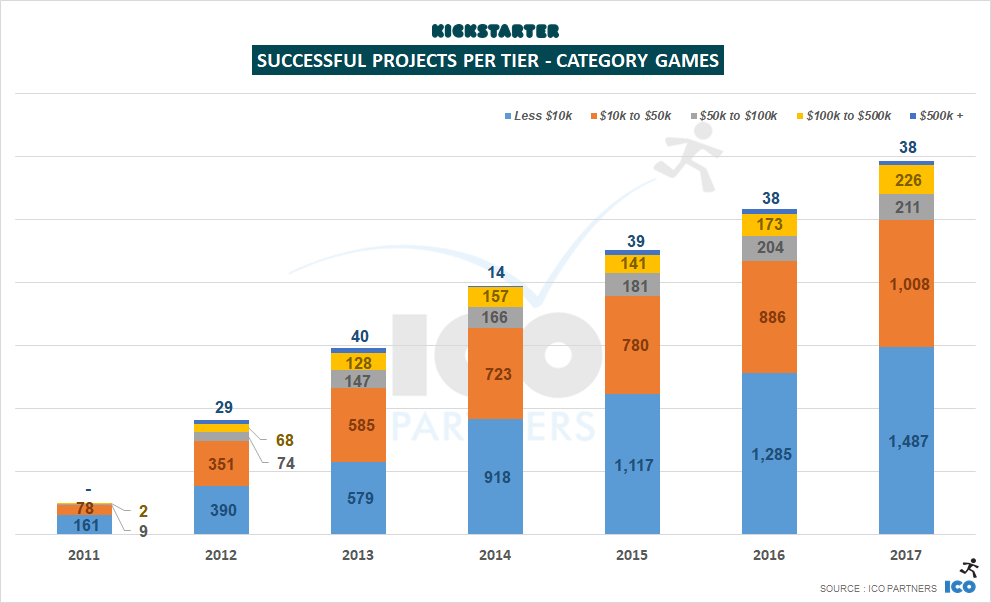
The number of projects in the top tier didn’t move from its 2016 figure – 38 Games projects raised more than $500k in 2017, the same number as the year before. A few very large projects represented a lot of the money raised. Notably, the record breaking Kingdom Death Monster 1.5, that became the #1 project in the Games category, raising $12.4m, and The 7th Continent, that raised $7m on its own. Together, these two campaigns represent more than 12% of all the money raised in the Games category, in 2017. And it is no surprise that they are both tabletop games project, and both of them are sequels/reprints of already successful Kickstarter projects.
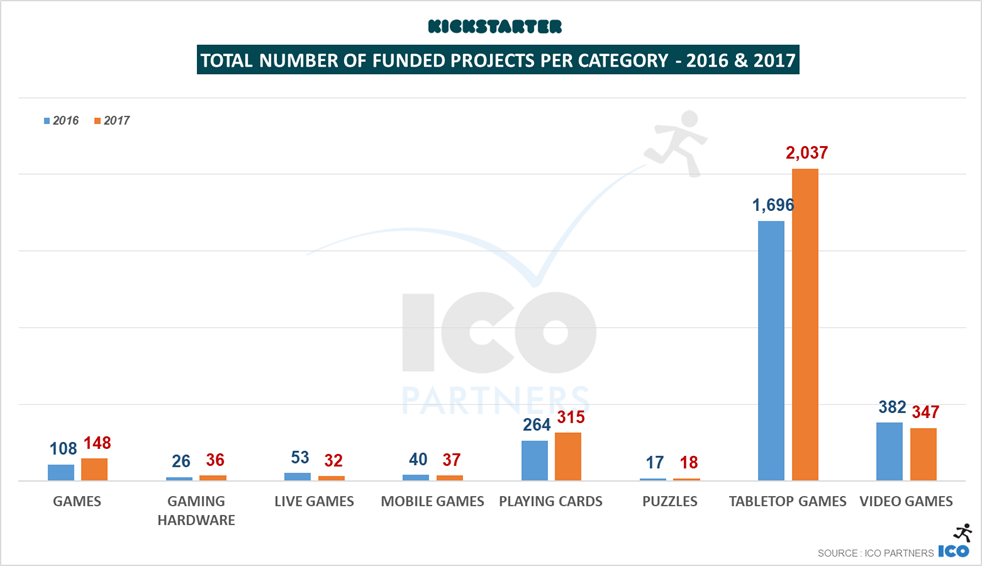
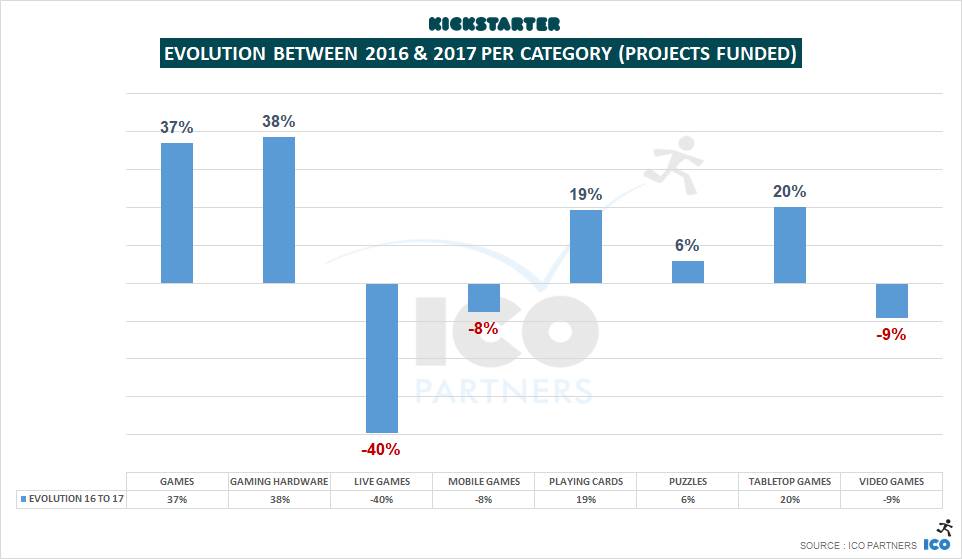
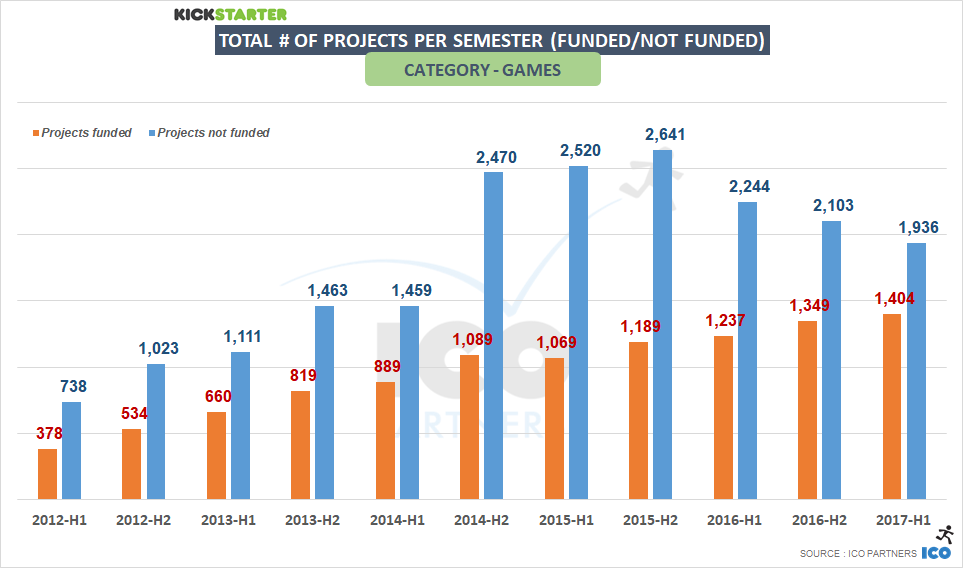
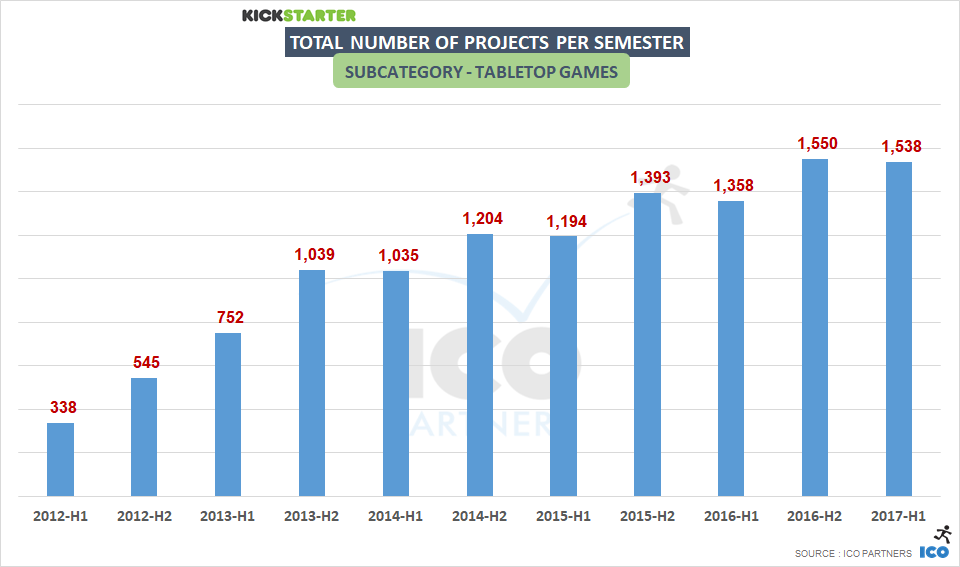
Looking at the subcategories, the number of funded projects for video games has dropped a bit from 2016. There are a few more Playing Cards projects and generic Games projects funded. But more significantly, the number of Tabletop Games projects has grown significantly, up 18% from 2016.
And of course, almost all of the growth in the total amount of money raised by Games projects is fed by the Tabletop Games subcategory.
A look at the minor subcategories
Games. This catch-all subcategory, meant to cover any project that the existing labels don’t properly represent, doubled in size in 2017, both in total number of funded projects and total amount of money raised. It is still a relatively small total, as it only covers those odd projects with an identity that’s hard to define, but it ought to be mentioned. To understand what this kind of projects these are, I give you the top two projects of 2017, both “golf” related: Chip-Down: Golf for the Non-Golfer and Beer Pong Golf : Golf Spieth Can’t Master
Gaming Hardware. We saw more hardware projects getting funded in 2017, but none of them was a mega hit. It is still worth noting than more projects passed the $100k bar than last year (five in 2017, compared to only one in 2016). And if you are curious, the largest project of the category was The Dreamcade Replay retro console.
Live Games. A niche subcategory, it has declined a bit in 2017, for the first time since its addition. One project passed the $100k mark for the first time for the subcategory. However, it’s a little bit at odds with the kind of projects you usually find there, and would probably be more at home beside the two previously mentioned golf titles in the Games subcategory. Take a look at CHIPPO: The New Golf Game for Beach, Backyard & Tailgate.
Mobile Games. A regular piece of advice I give to people is to not crowdfund mobile games, so I am quite biased when it comes to analysing this category. In 2017, it passed the $500,000 in total funding raised. That’s probably the equivalent of one day of Supercell’s marketing budget for Clash of Clans. There are still about 37 projects that got funded, about 10% of all the projects submitted, way below the average for games’ projects. One project raised more than $100k, Epic Digital Card Game, but it happens to be a port of a very successful tabletop game.
Playing Cards. The third-largest subcategory, it saw some growth in 2017 both in terms of the total amount of money raised (+21%) and the number of projects that were successfully funded (+19%). Very noteworthy as well, is the fact this is the first year we’ve seen a Playing Cards category project raising more than $500k – The Name of the Wind Art Deck raised $630,000.
Puzzles. The smallest of all the Games subcategories, it had 17 projects funded in 2016, and 18 projects funded in 2017. The total amount of money raised was less than half the amount from 2016, but with so few projects, big variances are to be expected.
And now, looking at the two big subcategories.
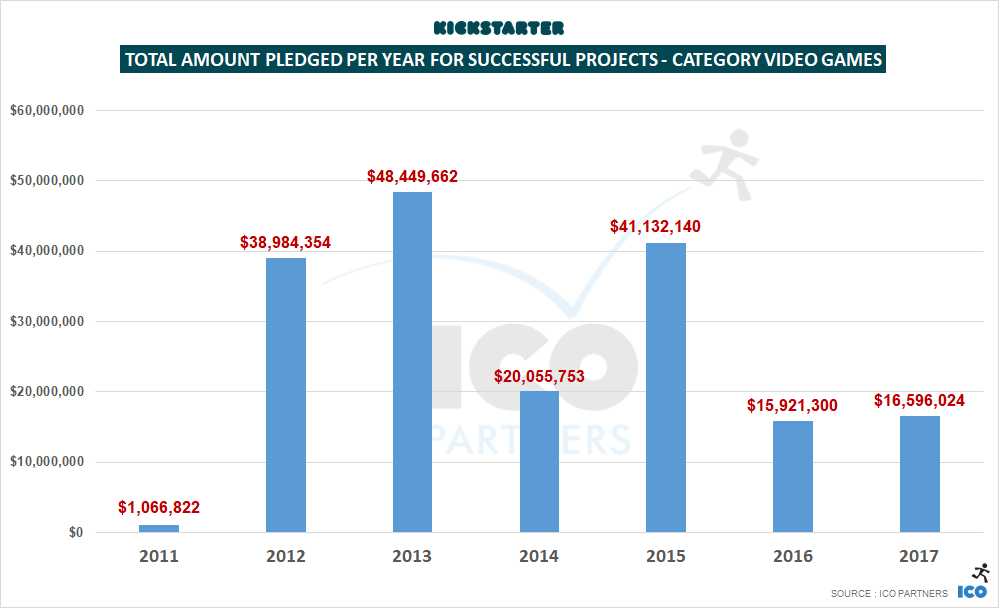
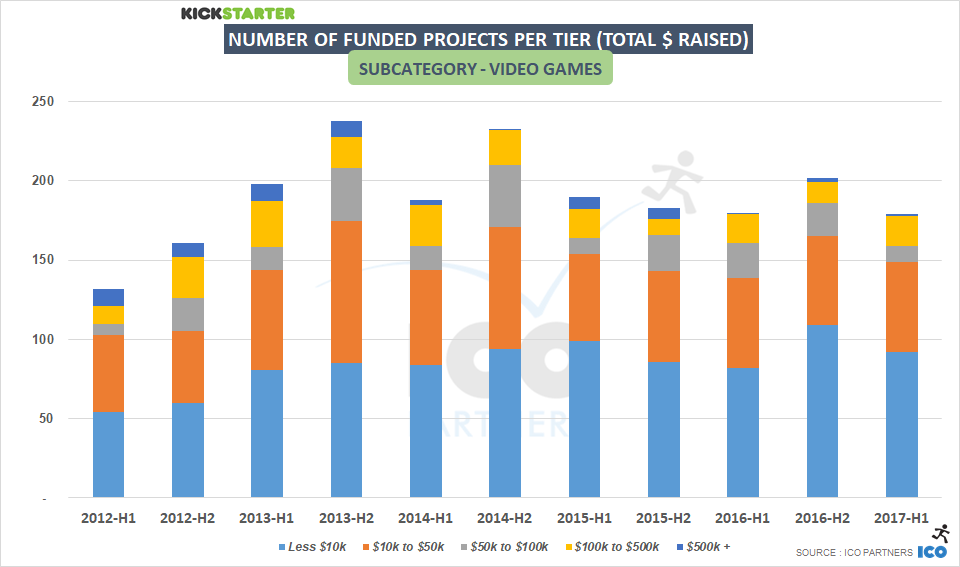
A stable year for Video Games
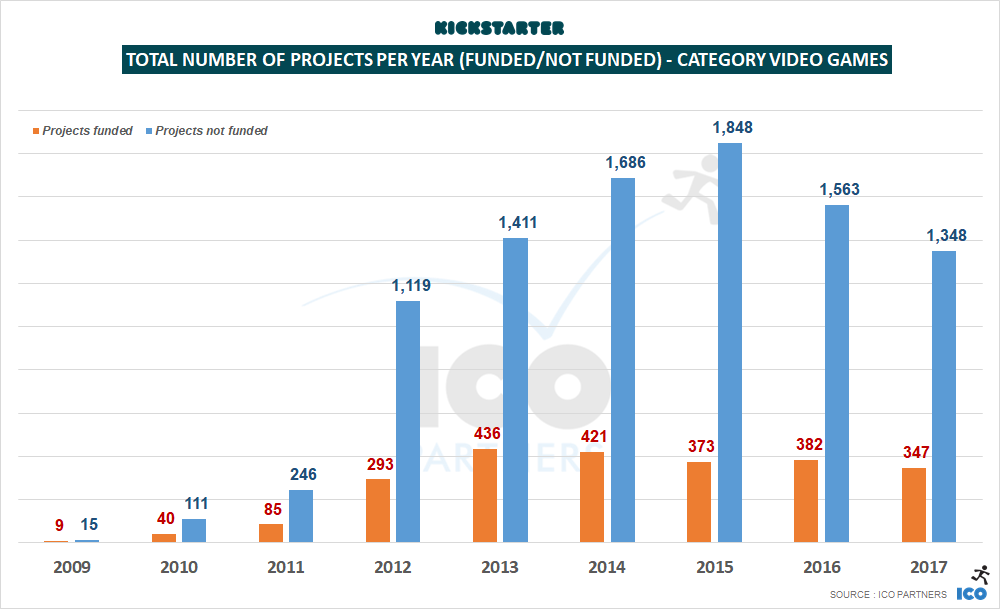
With slight growth in the total amount of money raised, and a slight decline in the total number of projects funded, 2017 doesn’t appear to be exceptional one way or another for video games on Kickstarter.
There are a few things worth noting, though:
The total number of video games projects submitted to Kickstarter is rising faster than the number of funded projects is declining. It means the ratio of funded projects is going up.
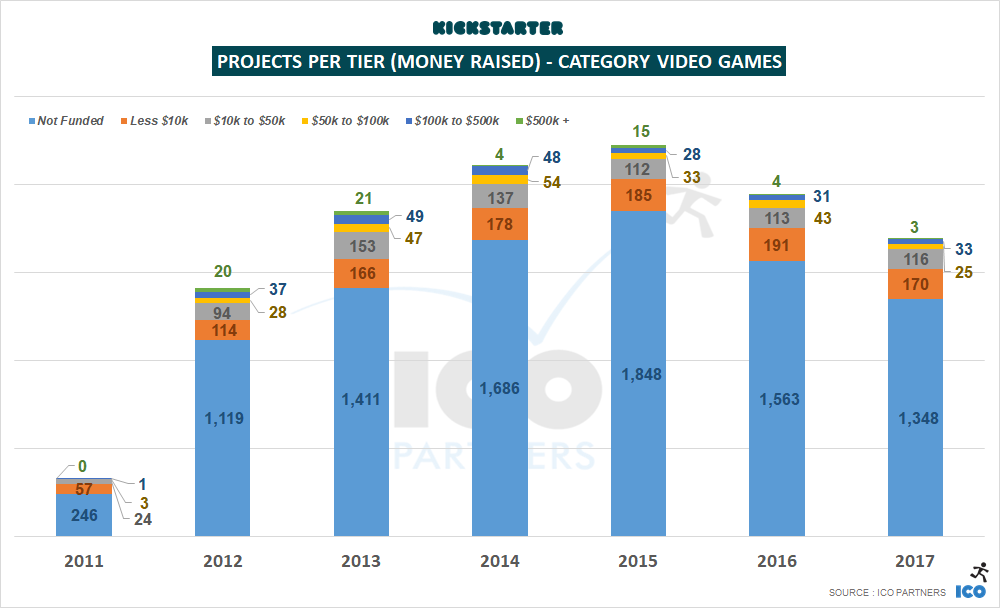
This is the first time we see a decline in the number of funded projects in the Less than $10,000 raised tier. The other tier that sees a decline is the $50k to $100k tier. So, notable changes in 2017 seemed to occur within more the very small, hobbyist projects, as well as the projects raising between $50,000 and $100,000. For all the other tiers, there were a similar number of funded projects across 2016 and 2017.
My theory for the decline of the smallest tier is that fewer creators are trying to crowdfund their projects, and it directly affects that range more than the others. Kickstarter doesn’t have the visibility it had in the media, and it doesn’t come up as often as it used to as a viable platform for small projects.
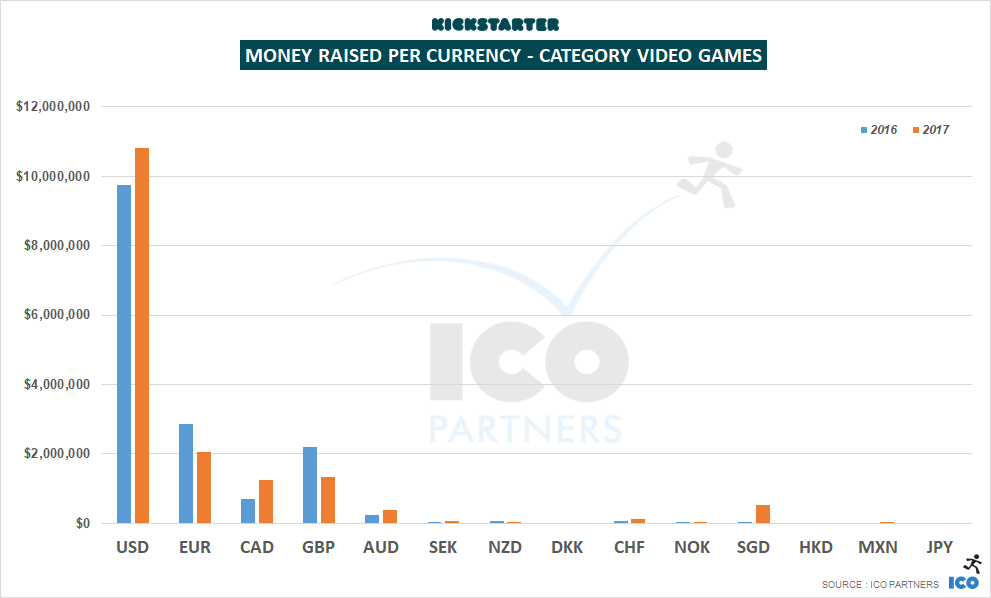
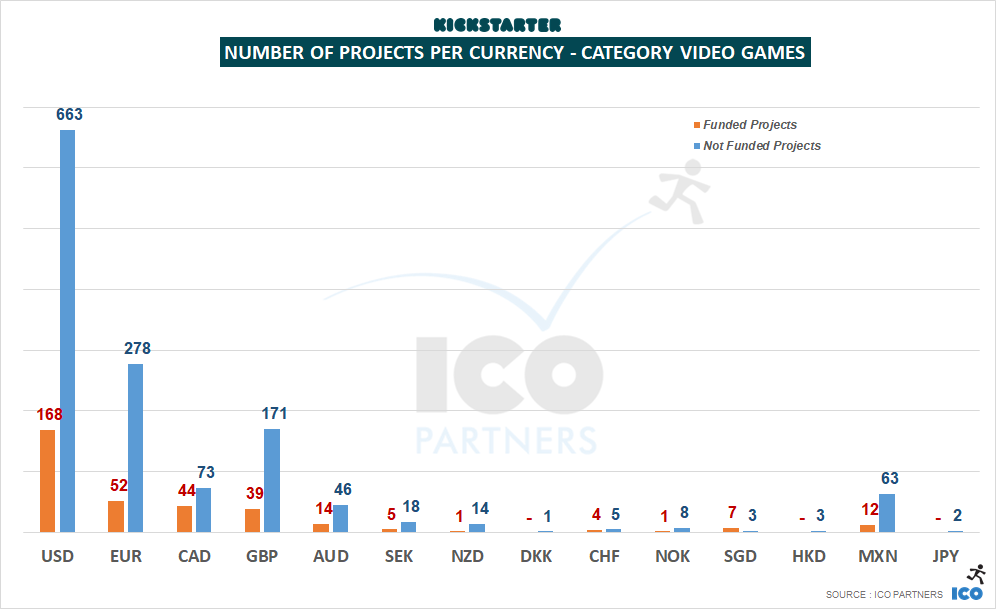
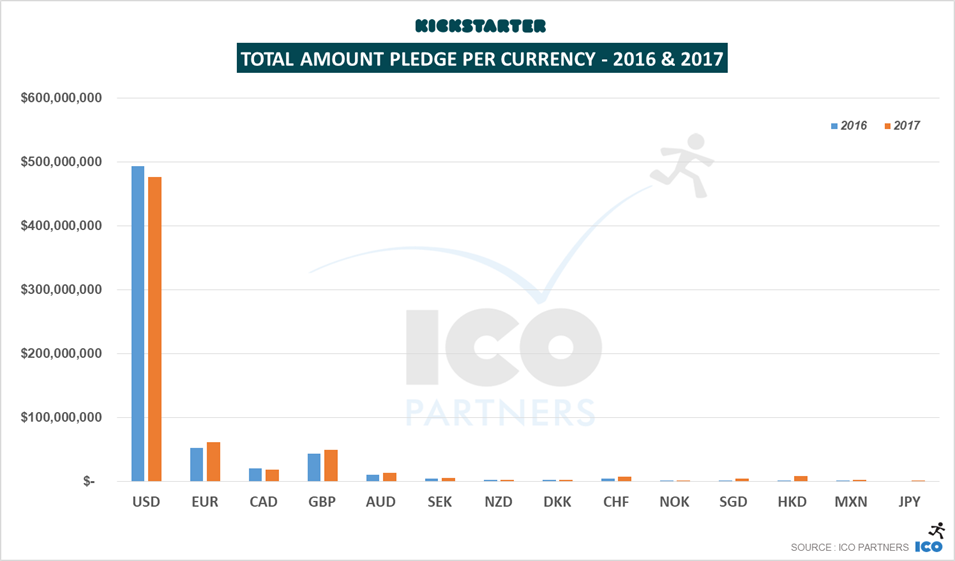
2017 was mostly a better year for video games projects launched in USD and CAD. A higher proportion of projects in those currencies got funded than those in EUR and GBP.
I found it interesting to see that 12 video games projects launched from Mexico got funded, even if that represents a small total amount in the end. Also notable is the absence of projects launched through the Japanese version of the portal, especially considering how some of the biggest crowdfunded video games of all time originate from there. Kickstarter’s September 2017 launch in Japan looks like a flop so far, and the video game category seems to be the best illustration of that.
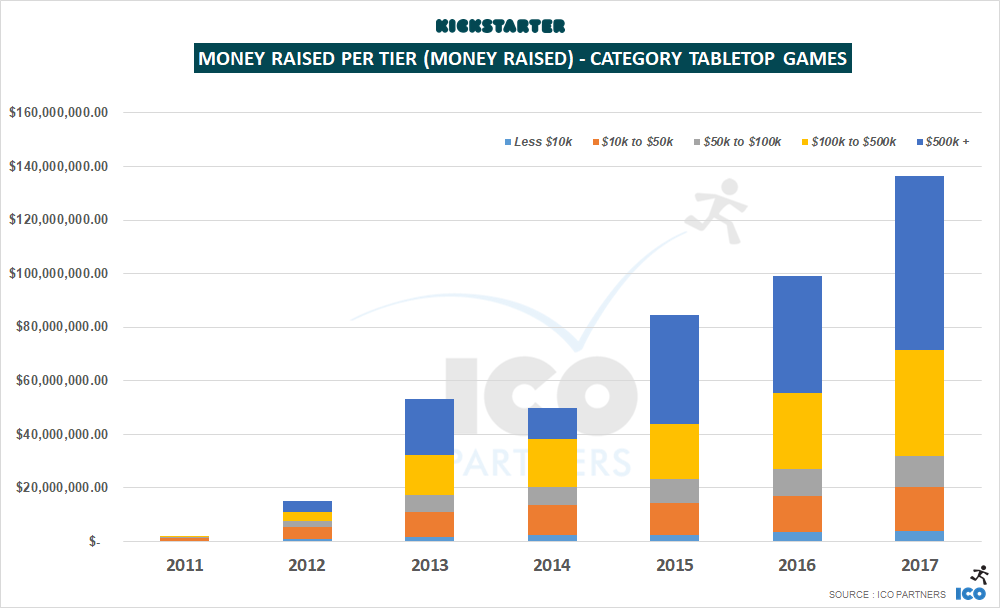
Tabletop Games: The Kings of Kickstarter
These two graphs tells the most significant story of 2017’s figures.
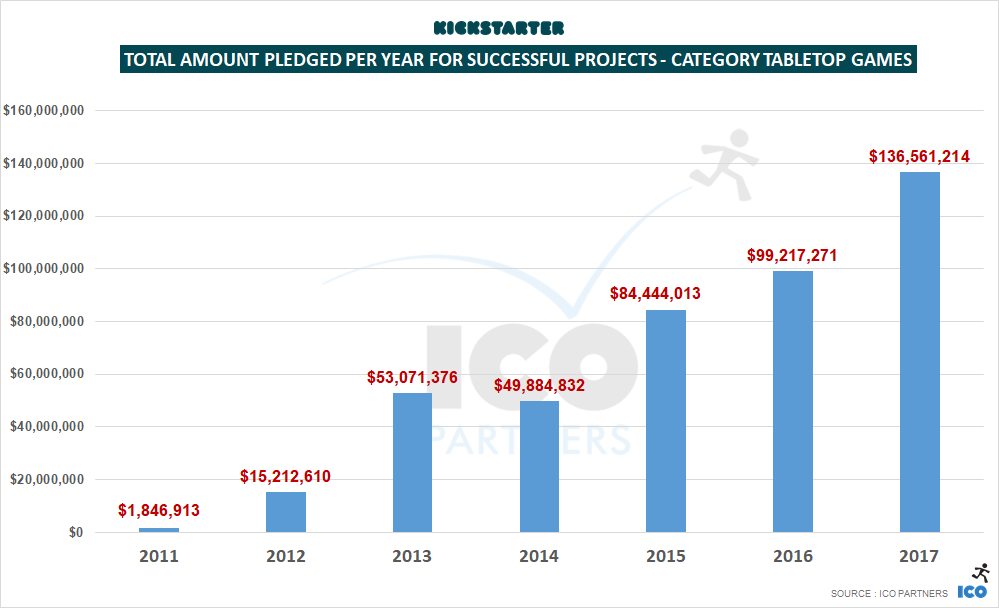
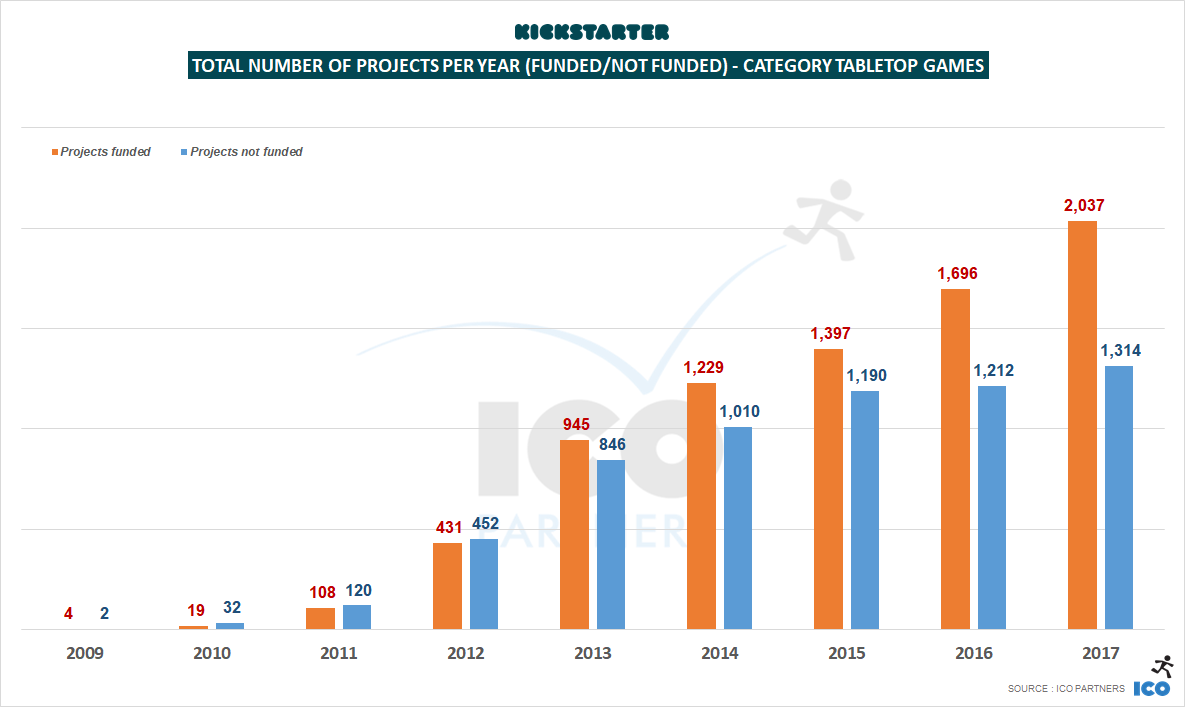
Tabletop Games have constantly grown over the past few years, both in terms of the total amount of money raised, and the number of projects funded. After a record year in 2016, the subcategory grew again, by +36% in 2017. The number of funded projects grew by +20%.
The growth invites questions, though. Will the subcategory stabilize? Will it crash? Can it keep growing?
There is no indication that its upward momentum will slow down anytime soon, even if record-breaking campaigns make it that much harder to keep up with the total amounts raised over a given year.
All the indicators for the subcategory are really healthy at the moment.
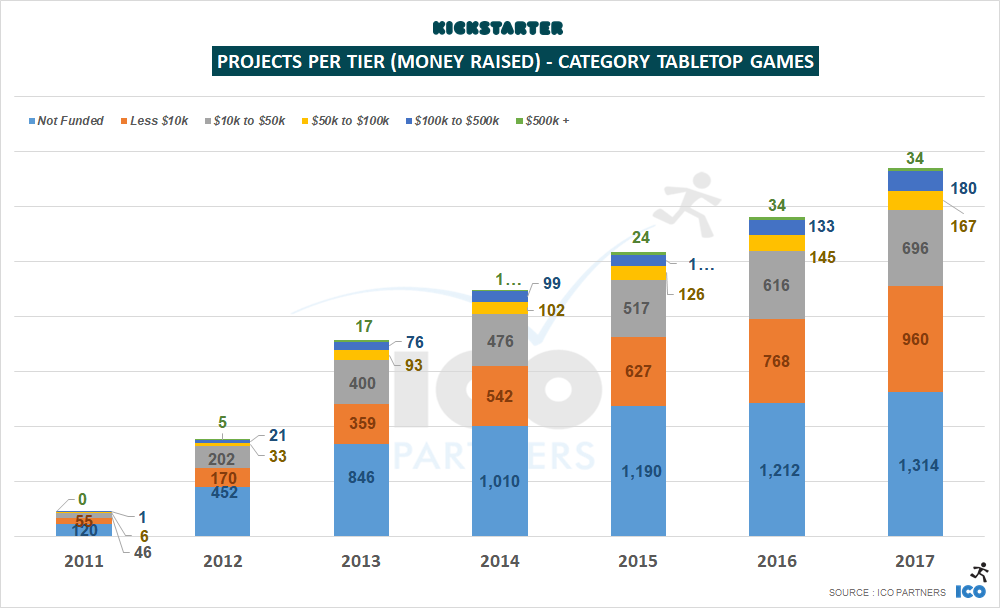
There has been growth across all tiers. This is, for me, a very important factor in determining how healthy the environment is, within this subcategory. If it were only good for the large, massive campaigns, it would not be a good sign; but having projects across all tiers growing shows that the ecosystem is not built upon a couple of metaphorical black swans, painting an inaccurate interpretation of the picture.
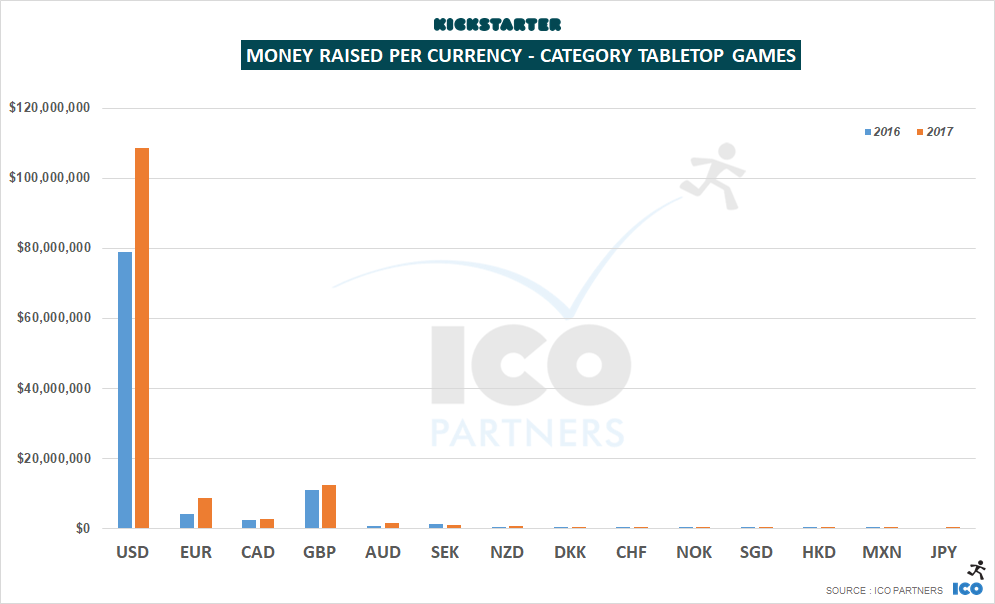
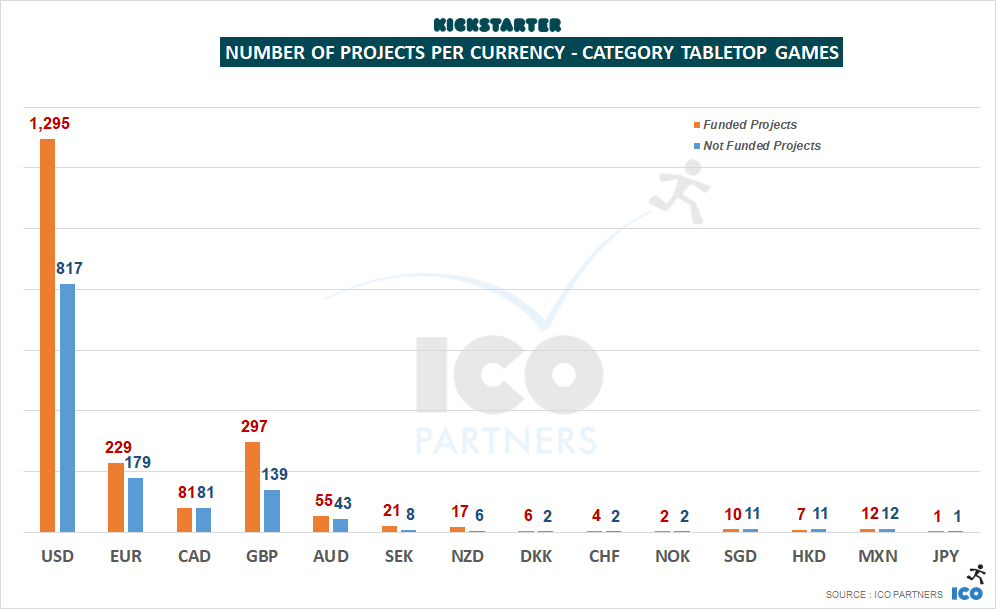
Projects across currencies are also finding success. Even if projects in USD represent the vast majority of the money raised and of the number of funded projects, projects in EUR and GBP are also healthy, representing more than 25% of the total funded projects.
This is especially interesting when you see campaigns that know that they will perform very well deciding to launch in USD, regardless of where they are based geographically. For example, 7th Continent, from a Paris-based company, launched their project in USD rather than in EUR.
Concluding thoughts
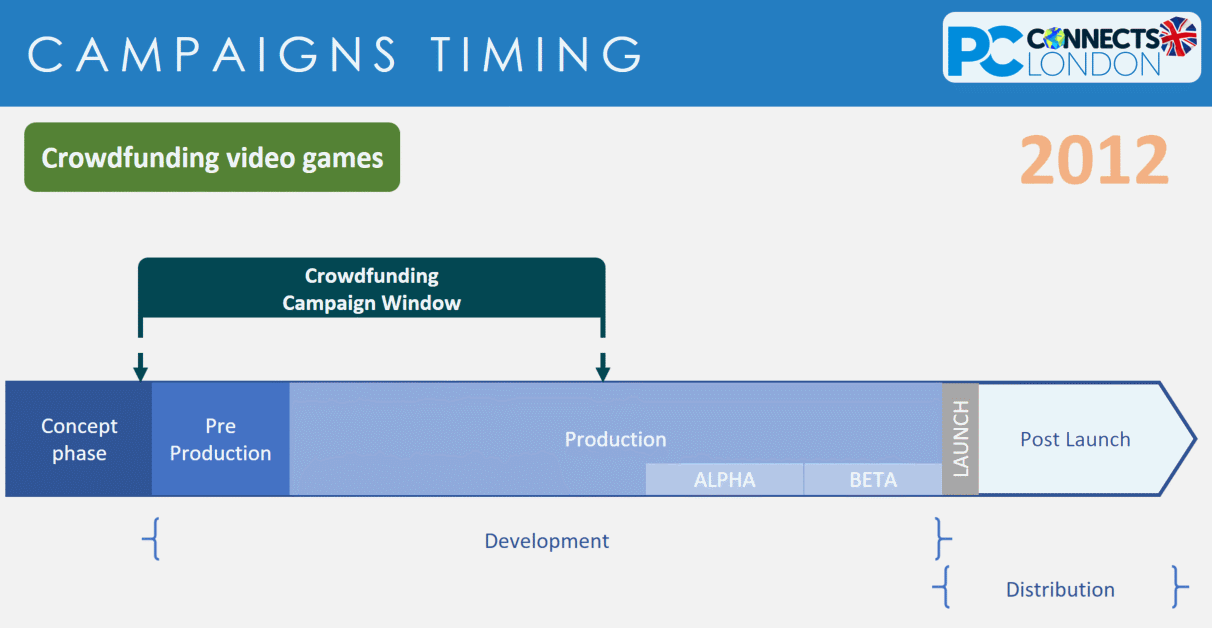
Last week, at the PC Connects in London, I delivered a presentation about the state of crowdfunding in video games. One point I made was the fact that Early Access is a much bigger competitor to Kickstarter than any other platform. One reason for this is the fact that, over the last year, the optimal window to launch a crowdfunding campaign for a video game has moved closer and closer to its ultimate launch. This is how I illustrated this (you need to click the image to see the gif in action):
What is very interesting is that, for tabletop games, that window has moved as well. Projects need to be more and more polished to get funded, but physical production means that the optimal window cannot move any further to the right.
The other important difference between video games and tabletop games is the fact that, for the latter, Kickstarter is the end solution for distribution for most projects. Whereas for video games, the end solution is Steam – Kickstarter helps a bit, but you still need to go to Steam.
So if your game in Alpha or Beta has a lot of appeal and replayability already, the chances are that when it is good enough to be showed on Kickstarter, it is also good enough to launch in Early Access. It is a lot less hassle, as you only have to concern yourself with the end game distribution platform. Early Access, however, doesn’t provide a lot of the perks that crowdfunding does – building the community, the opportunity to test your publishing skills, and building awareness – but I suspect to many studios, this is secondary, or underestimated.
What is also true, and a strong trend, is that many video games projects on Kickstarter are games that, by their nature, don’t have a lot of replayability (like, say, Point-and-Click adventure games) or immediate accessibility and audience appeal, making Early Access a path they cannot take.
Like for all previous blog posts on the topic, we have been using the data on the Kickstarter pages themselves (with the help of Potion of Wit) and the collection method is not without its own issues. Please consider all of the numbers presented here as estimates.
https://icopartners.com/newblog/wp-content/uploads/2018/02/header.png256710Thomas BIDAUXhttps://icopartners.com/newblog/wp-content/uploads/2020/04/CRUSHCREATIVE_ICO_BRANDING_LOGO_NavyWhite-01-e1586189748878.pngThomas BIDAUX2018-02-01 12:28:502018-02-06 10:33:38Kickstarter in 2017 – In depth look at the Games category
Before January is out, here is the annual look at Kickstarter for the year 2017. Where is Kickstarter going?
Overall funding bounces back
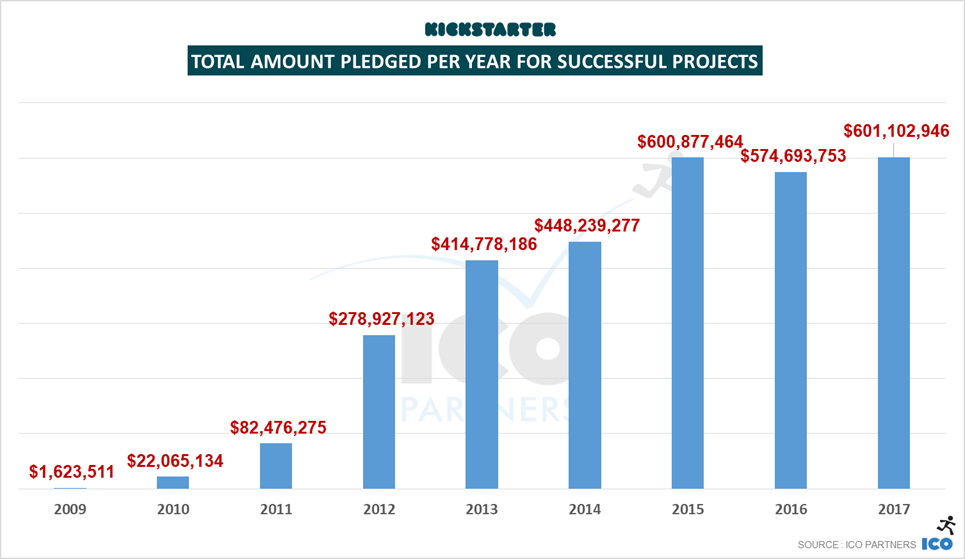
After its very first year of decline in funding of projects in 2016, Kickstarter sees a bounce back in the overall money actually raised.
That bounce is very timid though, even if it is enough to make 2017 the best year ever for the platform, this is a 0.03% increase from 2015, the previous record holder.
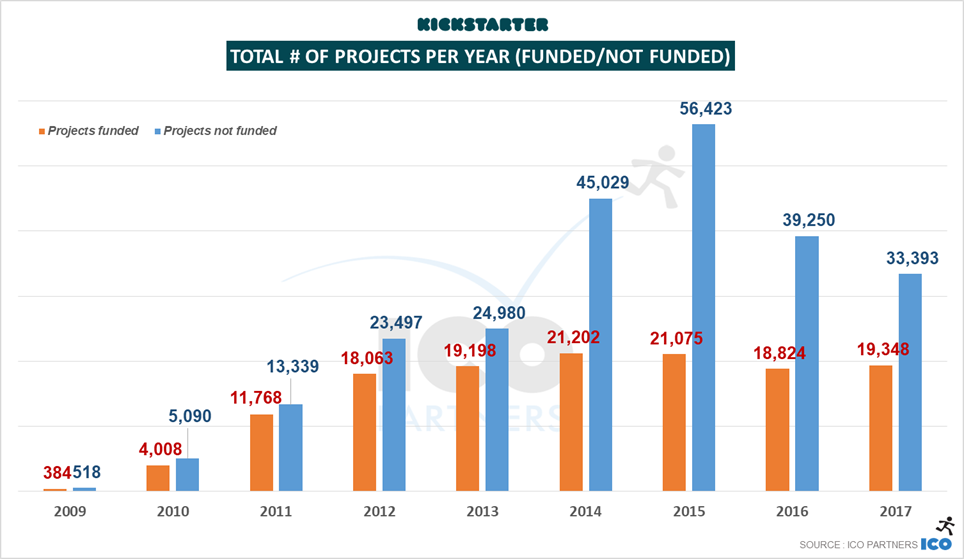
The number of funded projects doesn’t break the record though (from 2014), but it sees an increase from 2016 still.
What is remarkable though, is the number of projects submitted to the platform is still stumbling down, almost 6,000 fewer projects than the previous year, a -15% drop.
More funded projects, fewer projects overall, obviously the “success ratio” is looking better in 2017 than it has in a while.
Alongside the success ratio, we observed a drop in the ratio of project that raise $0 (also called the junk ratio). We are probably seeing the tail-end of the Potato Salad Effect.
Record breaking number of projects raising more than $100,000
If you are not familiar with the format I usually use, the following graphs are showing the breakdown of projects based on the amount they have raised (in USD).
Looking at the size of projects per tiers, there were more projects in all the funding tiers except the top ones. Even with fewer $500k+ projects than in 2016, there was more money raised on Kickstarter.
This comes from a record number of projects raising between $100k and $500k, and a sign of positive growth for the platform.
For the first time, in 2017, there were more than 1,000 projects raising more than $100,000.
Growth is almost coming all from the Games category
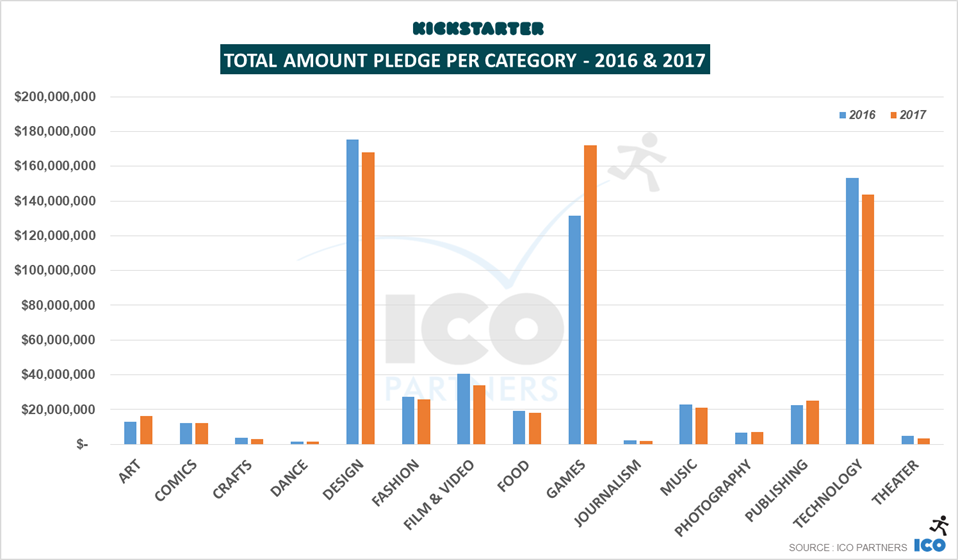
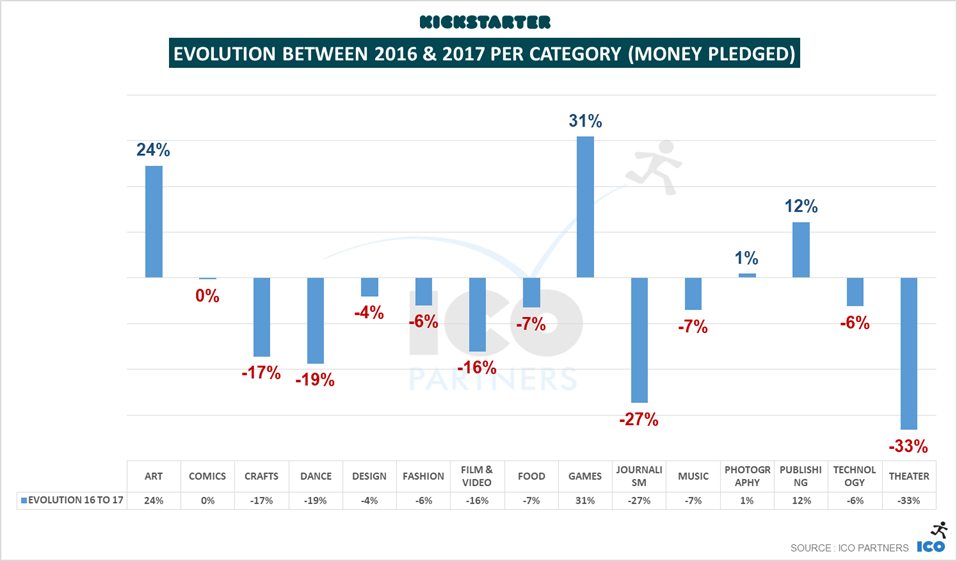
Looking at the categories in more detail, we can see that the growth observed in the amount of money raised is almost entirely coming from the Games category.
All other categories saw some declined in the amount of money raised, with the exception of Art, Photography and Publishing, respectively 2.5%, 1% and 3.8% of all the money pledged, where Games are now 26% of that amount.
Of course, the top three categories are still Design, Games and Technology, representing together 74% of all the money pledged in 2017. But this is the first time that the Games category takes the top spot.
Growth driven by non-US projects
There was more money raised across all currencies in the past year, except for the USD and CAD. Most of the of the money is raised in USD still, but since Kickstarter was launched in Europe, the total amount of money raised in EUR has grown every year, making it the 2nd ranking currency on the platform and representing almost 10% of all the money pledged.
A look at the categories
Kickstarter asks creators to put their projects in different categories. This allows us to look at the different trends of each of those categories. While you can find a lot more details in the documents on Slideshare, I have summarized some key takeaways for each of them below.
As usual, a dedicated blog post on the Games category will come soon.
Art
A record breaking year for Art. It passes the bar of $14m raised for the first time, including $2m raised by projects in GBP.
A significant growth in the number of projects that got funded as well, +24% compared to 2016.
Crafts
A relatively small category, the money raised by it dropped below $2,5m in total, while the number of funded projects grew a little bit. 25% of the money raised was done by projects in GBP.
Comics
The total amount of money raised in the category stayed about the same, but the number of funded project grew, and it has seen a constant growth for the past 6 years. There were more Comics projects funded than ever before in 2017.
Dance
Another small category, the amount of money raised and the number of funded projects are at their lowest since 2011.
Design
After constant growth in the past few years, in 2017, the category saw its first dip, albeit a small one (-2.5%).
On the other hand, the number of funded projects is still growing, and across all tiers of funding, except the $500k+ tier which had the same number of funded projects it had in 2016 (55 projects).
Also noteworthy, projects in EUR represented 14% of the money pledged in the category, up from 8.5% in 2016.
More funded projects but less money raised overall, the Design category illustrates very well the 2017 trend.
Fashion
The Fashion category saw a small decline in the amount of money raised, and a significant growth in the number of funded projects (best year to date).
Projects in EUR represented 16% of the money pledged last year, another category where projects in EUR grew in their shares of the category.
Film & Video
Once the poster child of Kickstarter, the category has been in decline for the past 4 years, with 2017 at record low levels.
The amount of money pledged has almost halved in two years and the number of funded projects is the lowest since 2011.
Two notable subcategories saw an increase in the amount of money raised, though: Documentaries and Animation.
Food
The Food category saw a small drop in the number of funded projects and the total amount of money raised, but it remained at a stable level from the previous year.
Games
Like last year, I will do a deeper dive into this category soon.
To note though, the vast majority of the growth observed in the category is coming from the Tabletop Games subcategory (more than 2,000 projects funded in 2017).
Music
The other former crown jewel of the platform, along with Film & Video, that is seeing a constant decline over the past 5 years. The decline is both significant on the financial side and the amount of money raised. The total number of projects that achieved funding was at 2,200 in 2017, down from more than 5,000 funded projects in 2012.
Photography
The category has been stable in terms of total amount of money raised, as the total number of funded projects here saw a decline for a second year. It is interesting to note though that the amount of money raised by projects in EUR has doubled year-on-year.
Journalism
This is still a small category. It saw a decline in both the total amount raised and the total number of funded projects for the second year in a row. However, the amount raised by projects in EUR and GBP has increased significantly, both representing almost 14% of the total of money raised.
Publishing
This was a year of growth for this category, on all fronts, money raised as well as number of funded projects. The growth was across projects in USD, GBP and EUR. Children’s Books is again the top subcategory.
Technology
Another year with a small decline of the money raised and number of funded projects for the category, even for projects in EUR.
Theatre
A fairly small category that continued its decline. It dropped to its lowest amount of money raised and number of funded projects since 2010 (when Kickstarter was just a year old).
Concluding words
2017 was not the best year for Kickstarter, but it still maintained a good level of funding. The good news is evident when you look at the number of projects that are funded on the platform. These are quite stable, and even growing in some categories, but the number of projects submitted to the platform are also going down. I believe that Kickstarter has suffered from the fact that many low-quality projects have been creating noise, presenting an image of a platform where “bad” projects are welcome. The fact that the number of junk projects is going down can only help the platform.
I have concerns though on how the communication of the platform hasn’t adapted to its new paradigm. It wants to be this platform for cultural projects, but films and music projects are becoming rarer, and it is not addressing the fact that games, especially tabletop games, along with design and technology projects, are what the platform is now about.
I am not suggesting to ignore its cultural roots, but very little has been done to improve the way the platform supports the current top categories. And the same could be said about the lack of features developed to support the expansion of the platform in non-English territories.
Like for all previous blog posts on the topic, we have been using the data on the Kickstarter pages themselves (with the help of Potion of Wit) and the collection method is not without its own issues. Please consider all of the numbers presented here as estimates.
https://icopartners.com/newblog/wp-content/uploads/2018/02/header.png256710Thomas BIDAUXhttps://icopartners.com/newblog/wp-content/uploads/2020/04/CRUSHCREATIVE_ICO_BRANDING_LOGO_NavyWhite-01-e1586189748878.pngThomas BIDAUX2018-01-26 13:05:422018-02-01 14:24:54Kickstarter in 2017 - Year in review
Like last year, I did a mini-research on games on Kickstarter at the mid-year point. It allows me to keep an eye on any trends, and to check hard data properly a little more often. On top looking at the Games category and the video games and tabletop games sub-categories, I am also throwing in a few numbers on Kickstarter overall.
As a side note, it was interesting to see that our Campaign Review service has been very popular this year, and I updated the page about it.
A few disclaimers on this article and the data:
A significant change I have made in my methodology is to use different exchange rates. I used to have a fixed exchanged rate applied to all projects. I now use the average of a given year. It will have an impact on the numbers you saw in the past.
I use the term Semester for a half year, from the Latin semestris, “of six months”.
Data is, as usual, collected with the help of our friends at Potion-of-Wit.
Kickstarter Overall – a steady course
Before we get into the numbers, I wanted to highlight a few things that have happened in the first half of the year:
As a Public Benefit Corporation, Kickstarter has released its first annual Benefit Statement. It is a very interesting read.
Kickstarter launched the Hardware Studio initiative. It comes on the heels of increasing reports of Kickstarter projects being copied and beaten to market.
Guest Pledging was introduced, allowing to back a project without having to create a user account.
And lastly, but more anecdotally, Yancey Strickler, the current CEO of Kickstarter, is looking for a replacement.
The last one I wanted to highlight as I sometimes find my research in media discussing Kickstarter, and they came up quite significantly in relations to that last announcement. But to the numbers, that’s what is of interest here.
As I have mentioned in the past, the Potato Salad campaign had a huge influence on the number of projects submitted on Kickstarter. If you are wondering about that sudden spike in the second half of 2014, that’s why.
Overall, we see a decline in the total number of projects launched on the platform, on quite a steep curve. However, the number of projects that get funded is seeing a very small decline in comparison. It’s also important to note that there are indications that the second half of a year usually performs better than the first half. And that’s usually true across all the categories.
You can see this effect a bit in the total amount of money raised by successful projects:
Despite the slight decline in projects, the first half of 2017 has been the best first half for the platform historically. It is very hard to predict how the second half will go, but it is likely that it will outperform the second half of 2015, making 2017 a record breaking year, improving from 2016.
Quick look at the Games category
I will share these numbers and chart as is. The analysis of the two main subcategories are much more telling of the current trend.
Video Games – at a stable pace
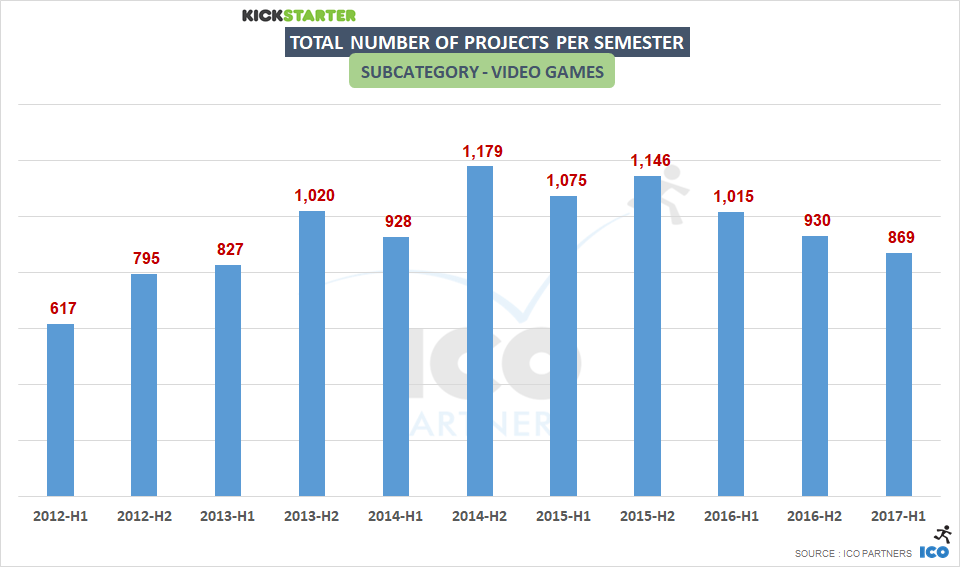
You have observed the growth of the Games category? Well, video games are actually not growing.
Video Games are keeping the same rhythm as the previous year, with roughly 30 projects per month getting funded. The second half of the year should probably see a few more projects funded than have been so far in 2017, if it follows the pattern of previous years.
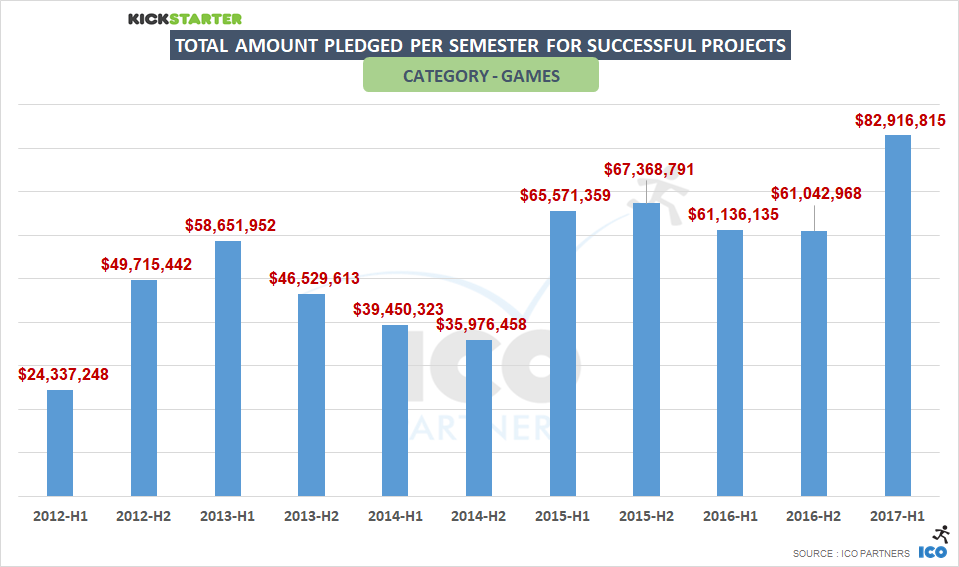
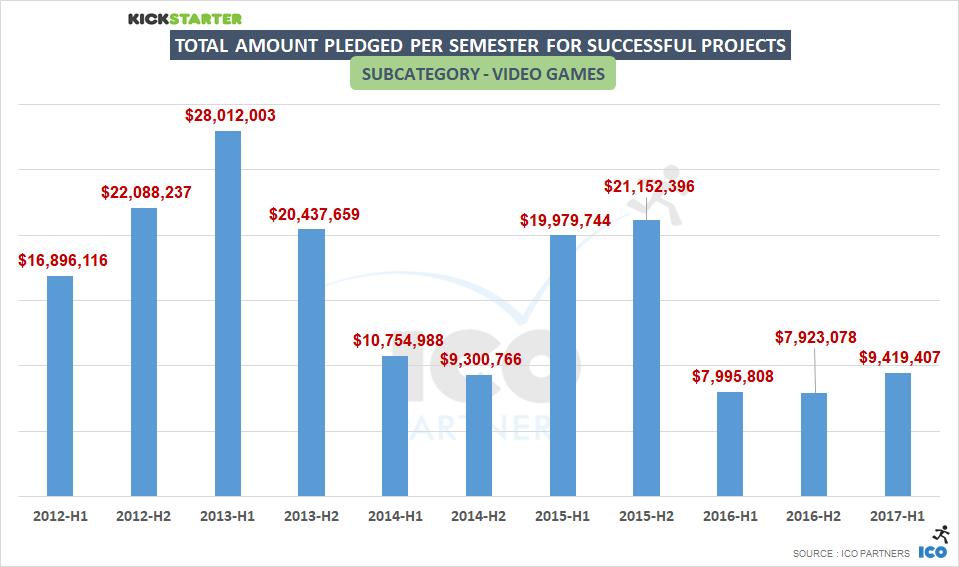
As seen in the past data analysis, the Video Games subcategory is very dependent on hits when looking at the total amount of money raised. In that sense, the first half of 2017 has been the best semester since 2015. And yet, this is a far cry from the best semesters in that subcategory.
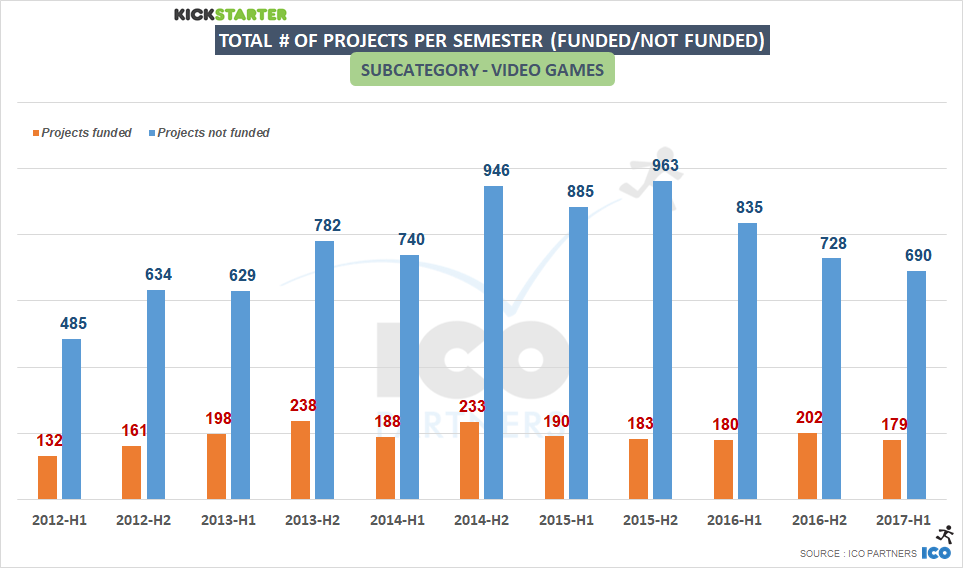
A stable number of funded projects, a growth in the total amount raised, despite Kickstarter having lost its novelty years ago now, it is still a platform that is consistent as a source of funding for games, the same conclusion drawn on the blog post from the beginning of the year.
An interesting evolution of the numbers when looking at projects tiered by amount raised, there is a growth of the number of projects raising between $100k and $500k recently. It seems this is a range of funding that is more accessible than it used to be, and could be where Kickstarter could grow its Video games subcategory.
The crazy growth of Tabletop Games
If we can’t see how the Games category can be performing so well from looking at Video Games, it probably means that Tabletop Games are doing incredibly well. That is quite the understatement:
Looking first at the number of projects, it is obvious that this subcategory of projects is bonkers:
There is a strong and steady growth of the number of projects that are funded.
There was no “potato salad” speculation effect in the second half of 2014 (at least, not as visibly as in other parts of the Kickstarter platform).
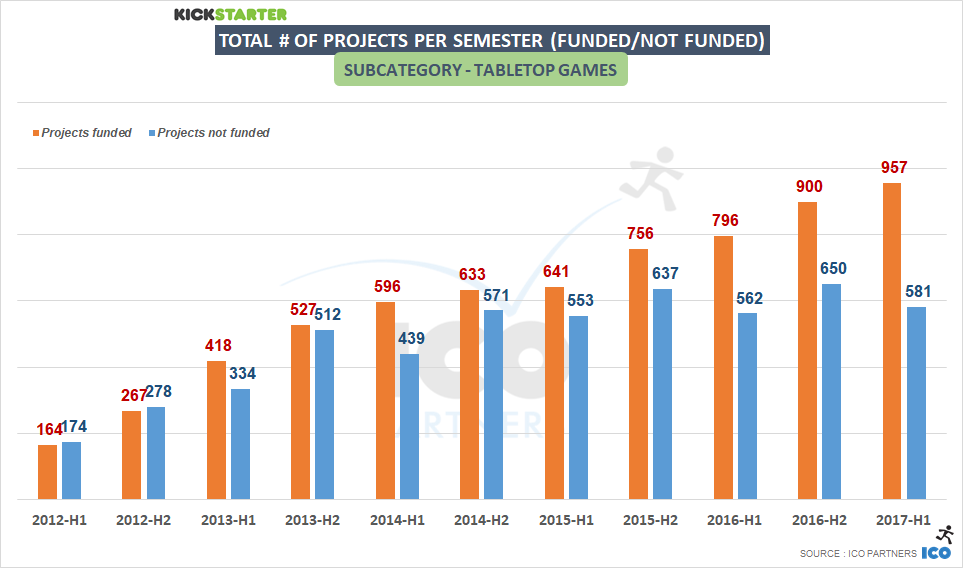
The number of projects failing is stable, meaning the success ratio is steadily increasing (62% of the projects got funded in the first half of 2017)
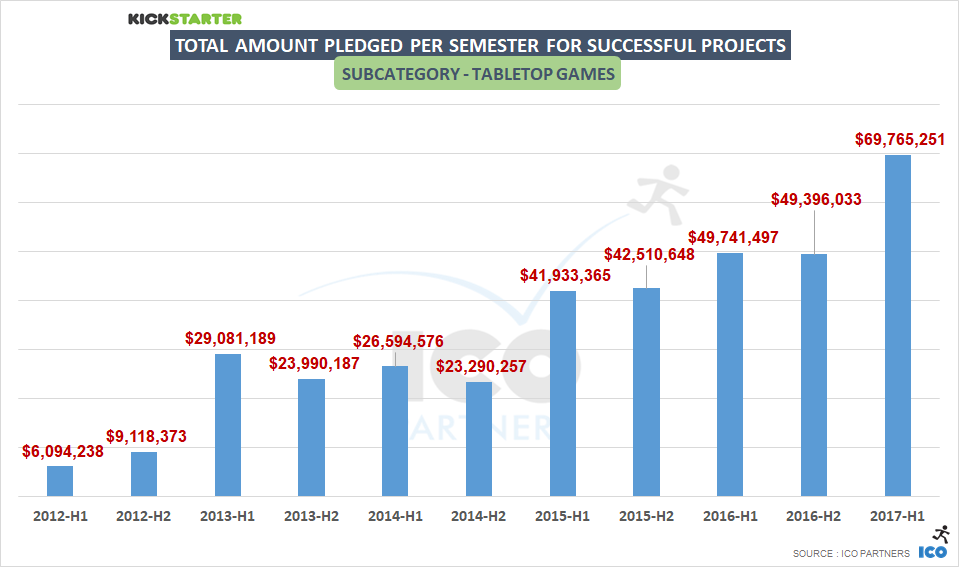
Following the steady growth of funded projects, it is not surprising to see a record breaking half-year, and if current trends continue there is no way that 2017 is not going to be the best year ever for the subcategory too.
Let me share the number that I find the most mind-boggling in the mid-year update:
24% of the money raised by successful projects on Kickstarter were Tabletop games projects
Of course, the huge success of Kingdom Death Monster 1.5, that raised $12.3m, plays a role in that impressive performance. But the growth is seen across all the strata of funding:
Across all tiers (except the lowest one) this was a record breaking semester in the total amount of money raised.
Conclusion
With board games growing so fast, and the rest of Kickstarter being still quite stable, it is clear there is a shift not visible at a first glance on the platform. There is a slight decline, or at best stability, across all categories, with the exception of one that keeps growing steadily.
By the time Kickstarter has found its new CEO, I can easily imagine games representing a third of the money raised through the platform.
And Games projects might be blurring the line between tabletop games and video games further, like the currently live campaign of Beasts of Balance:
https://icopartners.com/newblog/wp-content/uploads/2014/03/kickstarter_header.png256710Thomas BIDAUXhttps://icopartners.com/newblog/wp-content/uploads/2020/04/CRUSHCREATIVE_ICO_BRANDING_LOGO_NavyWhite-01-e1586189748878.pngThomas BIDAUX2017-07-31 23:39:162017-08-01 12:55:36Kickstarter and Games - 2017 mid-year status update
As promised last week, here is a deep dive into the Games category on Kickstarter for the year 2016. The format will follow the same as the article I did last year on the same topic. Please bear in mind that I will exclusively look at Kickstarter, and not any other crowdfunding platform here. For a more general outlook, specifically on video games, you can read my guest article on GamesIndustry.biz.
As usual, at the end of the article you can find more graphs in the dedicated SlideShare presentation.
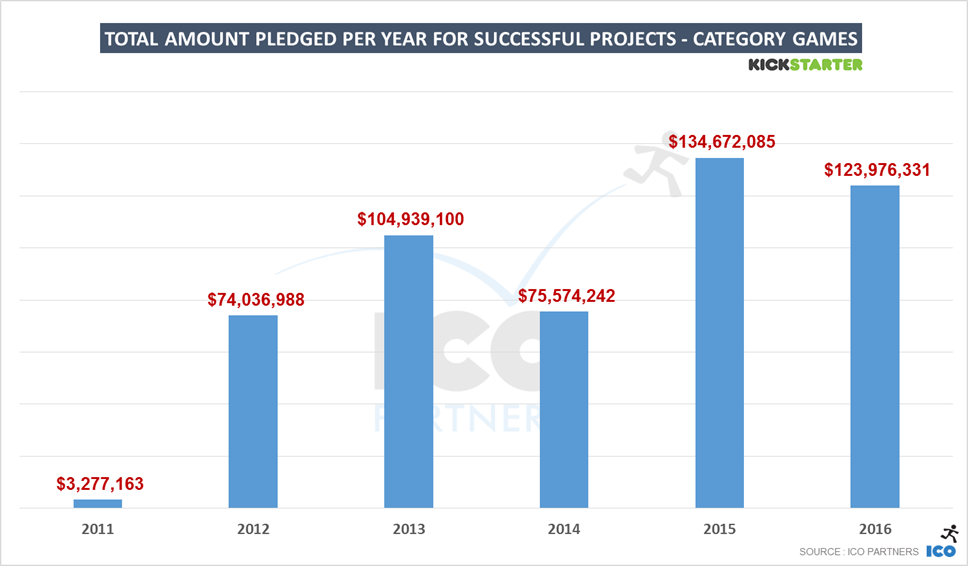
The whole Games category
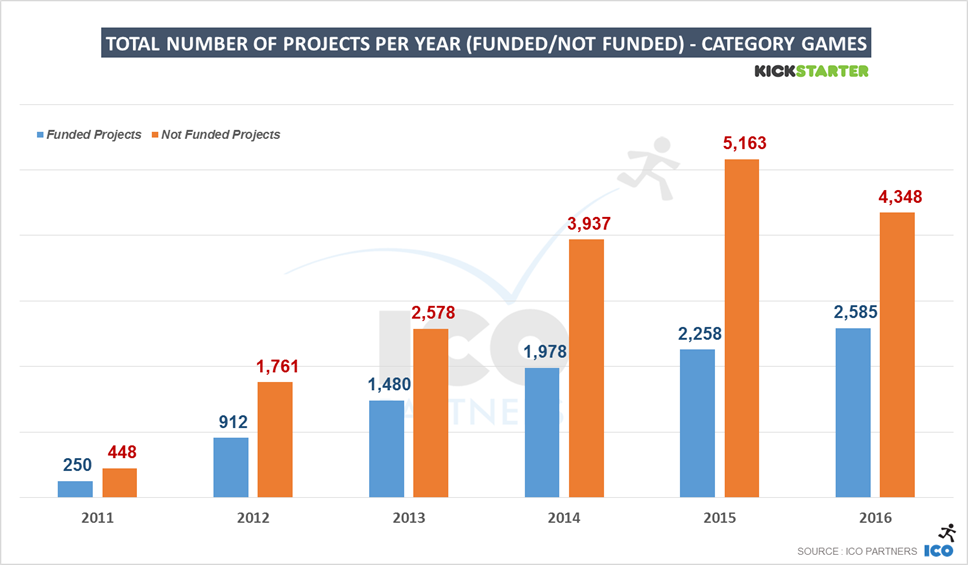
As seen last week, like most categories on Kickstarter, Games saw a decline in 2016 in money raised compared to 2015 (-8%). This is still the second biggest year on record in terms of money raised, and in fact, there were more projects funded in the category than ever before (+14%).
The growth in the number of funded projects however comes with a decline in the total number of projects seeking funding on the platform. Fewer projects on the platform, but more projects funded – the ratio of success is climbing. The platform is maturing, the general audience understanding of what it takes to get funded is getting more sophisticated.
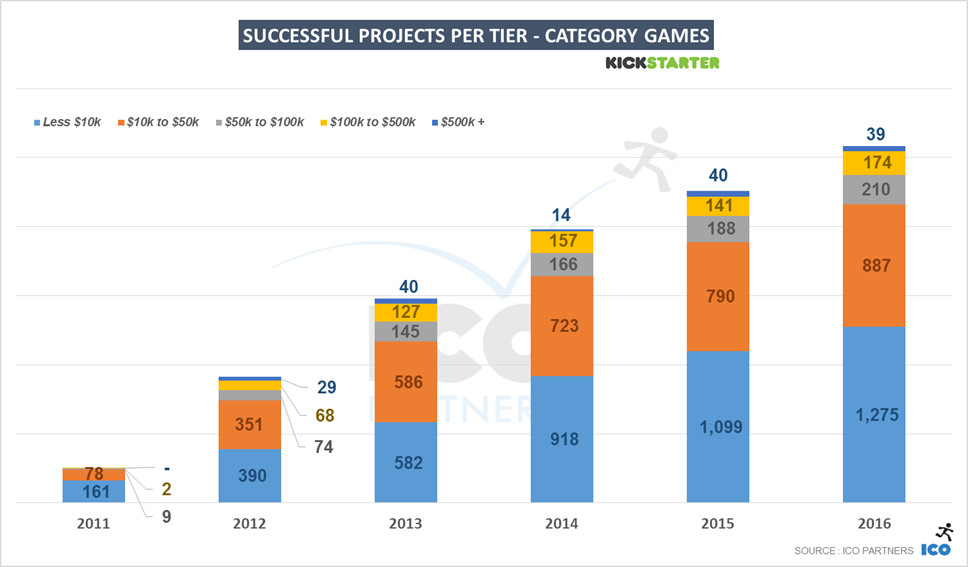
In terms of money, it’s interesting to observe that the overall year-on-year decline only happened at the highest tier, with the projects raising $500,000 and more. All other tiers showed growth (+18% across all those projects).
Interestingly, there were a similar increase in the number of funded projects across all tiers except for the highest tier. There was 1 less project funded in the highest tier (but considering there are fewer projects, that represents -2%). All the other tiers had at least +12% growth in the number of funded projects.
In both number of funded projects and money raised, the tier with the largest growth is the $100,000-$500,000 tier (respectively +23% and +27%). In last week’s blog post, the trends were interpreted as showing an increase in the professionalism of the campaigns on Kickstarter, and this again reinforces that sentiment.
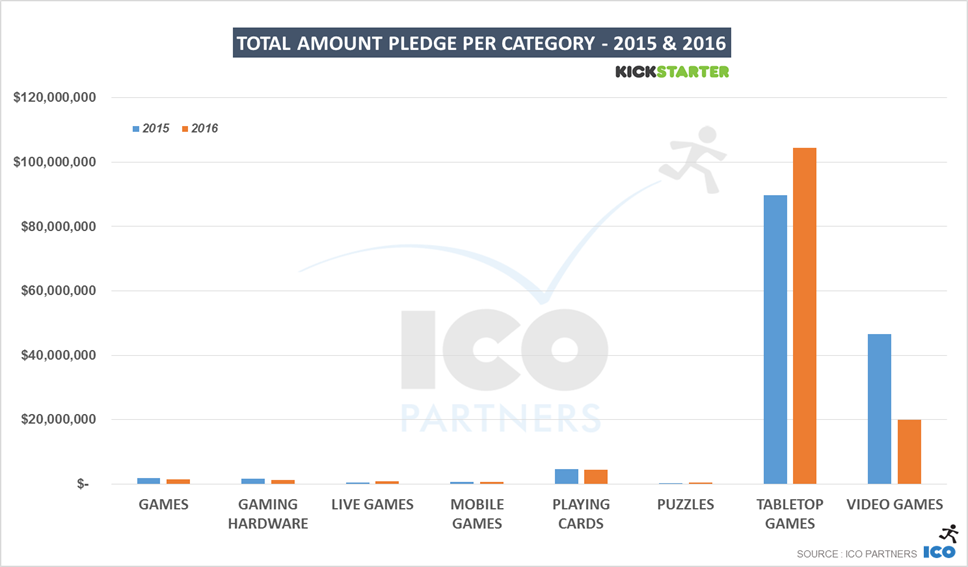
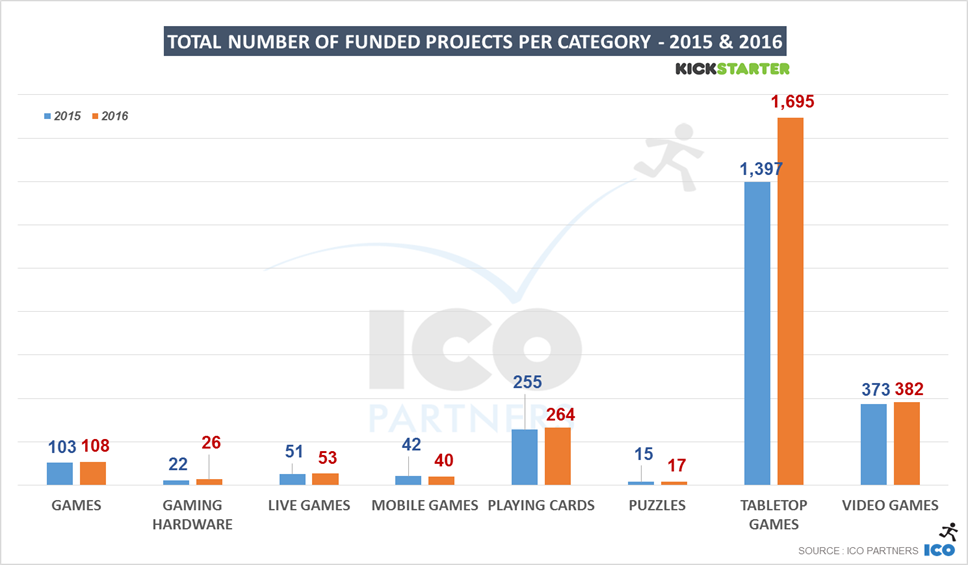
Like last year, there are two subcategories making up the most of the Games category: Tabletop Games and Video Games. All the other subcategories only account for 7% of the money raised and 30% of the funded projects.
Overall, most of the decline in the games category happened for the Video Games projects. Less money (-57%) and fewer funded projects (-13%) account for the difference from last year for the Game category.
Smaller Subcategories
Before getting into the two main actors of the Games category on Kickstarter, here are a few new insights on the smaller subcategories from 2016:
Games. This catch-all subcategory, meant to cover any project that the existing labels don’t properly represent, has declined again. I suspect this is more due to project creators opting more and more for existing subcategories, and hoping for success by association, than any actual revealing trend.
Gaming Hardware. The Ouya and the Oculus campaigns haven’t had many successors. In 2016, less than $800,000 was raised by 26 projects in this category. It’s not much when you consider that the Smach Z campaign alone raised more than $500,000 (the first project to manage to do so in this subcategory since 2013). A campaign ran in EUR, it also means that it was the leading currency platform for that subcategory, raising more money than all the other currencies combined.
Live Games. A niche subcategory, but growing every year. It more than doubled the money raised year-on-year, with only +4% more projects. For the first time, projects in this category raised more than $50,000 (3 projects in fact). No project managed to raise more than $100,000 yet, but the highest managed to reach $90,000 in funding, so it might be a threshold passed this year.
Mobile Games. I have a very strong opinion on Mobile Games and crowdfunding – I believe they are not meant to do well together. It doesn’t mean nothing is happening in this subcategory. 40 projects got funded, raising a total of $460,000 between them. Also, for the first time since the subcategory was added, a project raised more than $100,000 (this game) too. Surprisingly, the 2nd currency is AUD, with 4 funded projects that raised between them $64,000. Good job, Australia! (If you believe I’m being snarky, you might be onto something)
Playing Cards. The 3rd largest subcategory, it saw a small decline from last year in money raised (-2%) and small increase in the number of funded projects (+4%). This said, there were larger projects than ever before. The number of projects raising more than $100,000 went from 2 in 2015 to 5 in 2016.
Puzzles. The smallest of all the Games Subcategories, it had 17 projects funded last year, and together they raised $350,000, almost triple the amount from 2015. This is mainly thanks to the amazing Codex Silenda campaign, that raised $210,000 by itself – and would have raised much much more had the creator not been humble (and sane) and capped the number of items you could back. Seriously, check it out, it’s incredible.
And now, to the main contenders.
Video Games
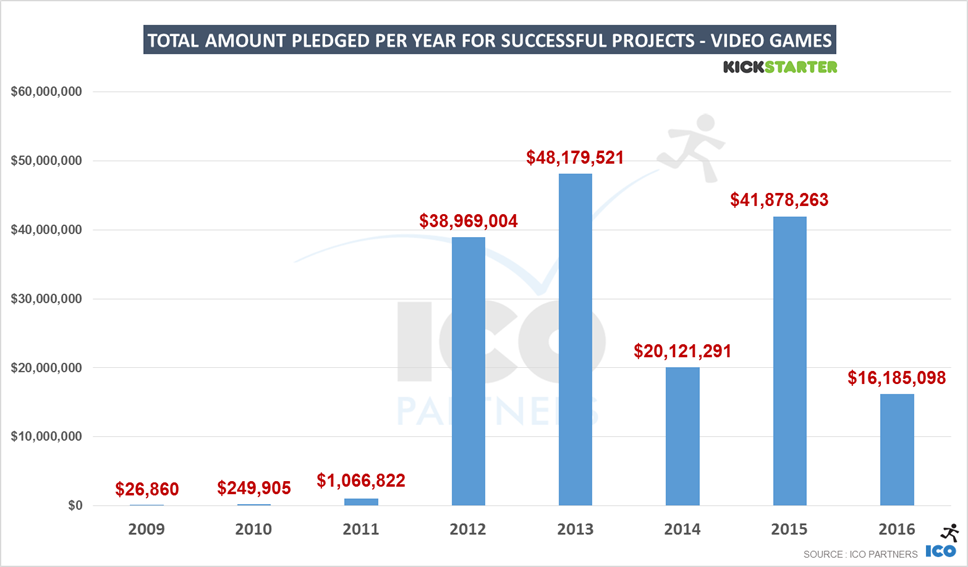
There is no ignoring the significant drop in the total amount of money raised for video games in 2016. With $16m, this is the lowest raised on the platform for this category since it exploded in 2012 after the initial funding of The Broken Age by Double Fine.
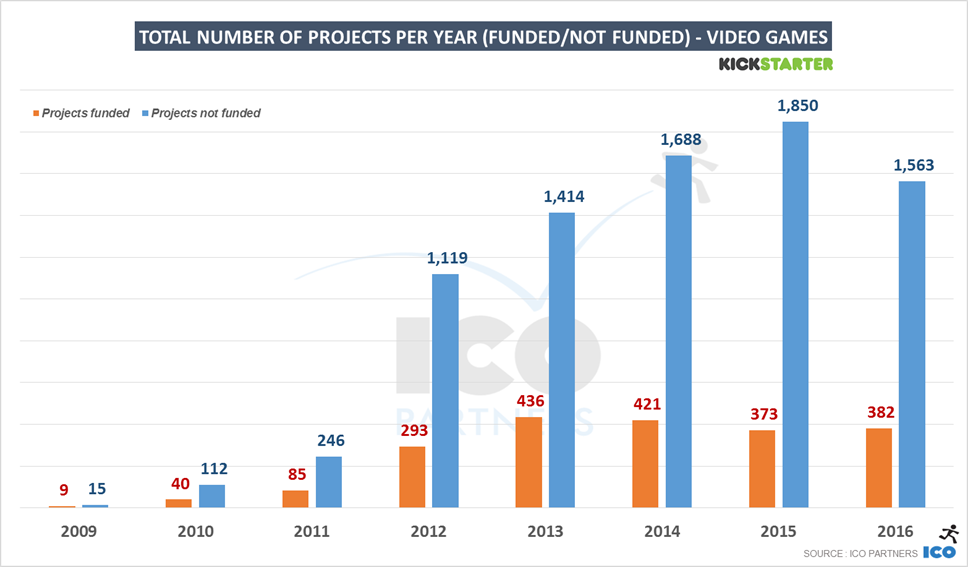
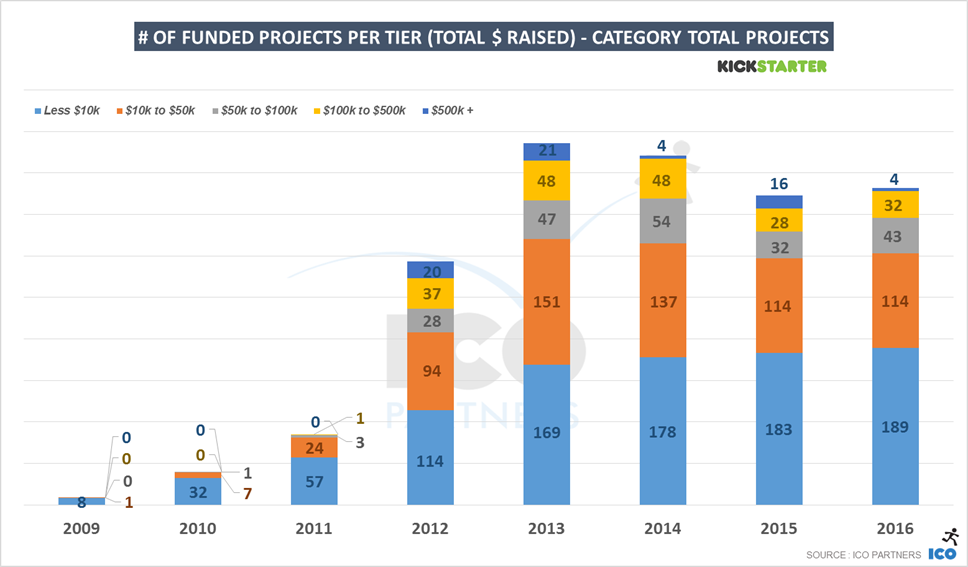
When accounting for the total number of projects funded though, the year-on-year change is a lot less drastic (-13%). That’s the platform 3rd best year in that regard. Before diving into the breakdown of projects per tier, it is obvious that the significant drop in the total amount of money raised is significant partly due to the absence of large projects.
Looking at the amount of money raised per tier first, the highest tier of funding was almost a 1/10th of what it was in 2015. If you ignore that tier, there actually was more money raised on Kickstarter than the previous year. Kickstarter in 2016 missed out significantly from this lack of high level projects. Of course, Fig.co hosting Psychonauts 2 and Wasteland 3 didn’t help. But even if these two projects had been funded on Kickstarter, 2016 would have been a low performing year (whether you account for the project equity of the Fig.co or not).
It seems that there’s only ever a limited volume of such large projects considering crowdfunding, meaning there will be a visible effect on the overall performance for the video games category in crowdfunding in any given year based on the volume of these high performance projects – there will naturally be years where lower numbers of these big projects come to the platform due to factors such as the long development cycles. This will likely continue, unless crowdfunding suddenly becomes more popular with studios (in the way it’s popular for Tabletop Games as we will see next), but this seems very unlikely given the current trends and the nature of what it takes to create big video game projects.
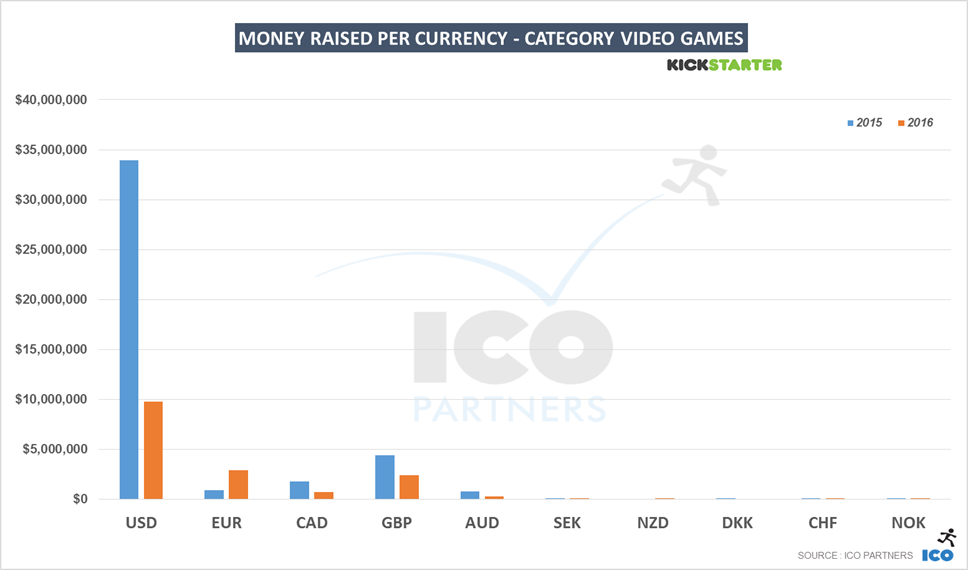
The share the projects in USD represents has drastically dropped this year. The common idea that you have to launch your project in that currency to succeed for video games should be dismissed by looking at this year’s numbers. With the projects in EUR seeing a considerable increase, they represented 18% of the money raised for video games last year, with GBP projects representing 15% of the total. USD projects, that raised 81% of the total amount of money raised in 2015 for video games, represented only 60% of the total amount raised last year.
Looking at the number of projects every week on Kickstarter, the trend is not of a collapse in the number of funded projects. There were fewer projects launched on the platform, and across all categories, but for the past 2 years it seems that the volume of projects being funded is actually quite stable.
Another unseen competitor is Steam Early Access. The minimum required quality to launch a crowdfunding campaign for a video game is such (beautiful assets, good video, demonstrable gameplay) that it wouldn’t be surprising if many projects considering crowdfunding simply decided to skip it, and go in Early Access instead, with the idea to be able to start getting revenue regularly directly on the main platform the game is sold on to the end users.
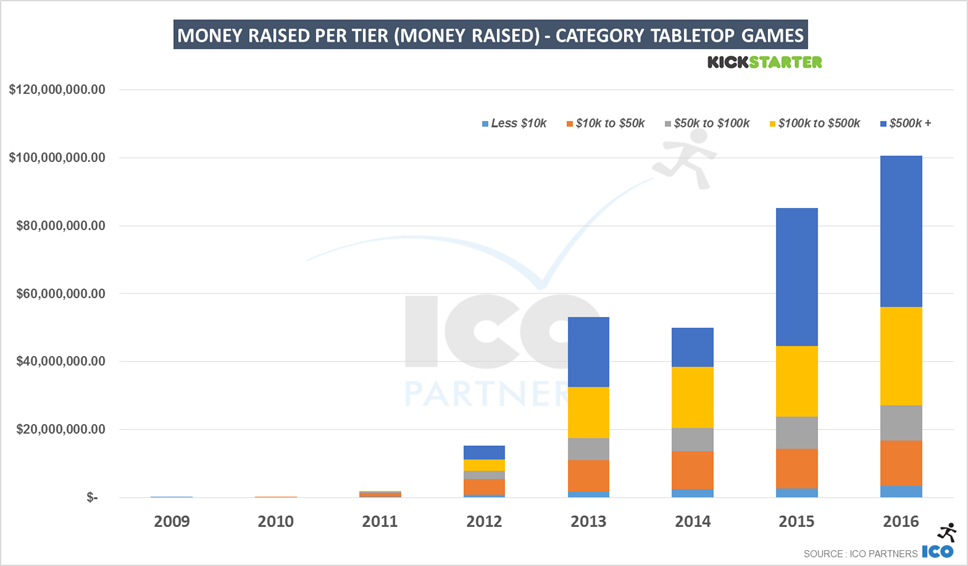
Tabletop Games
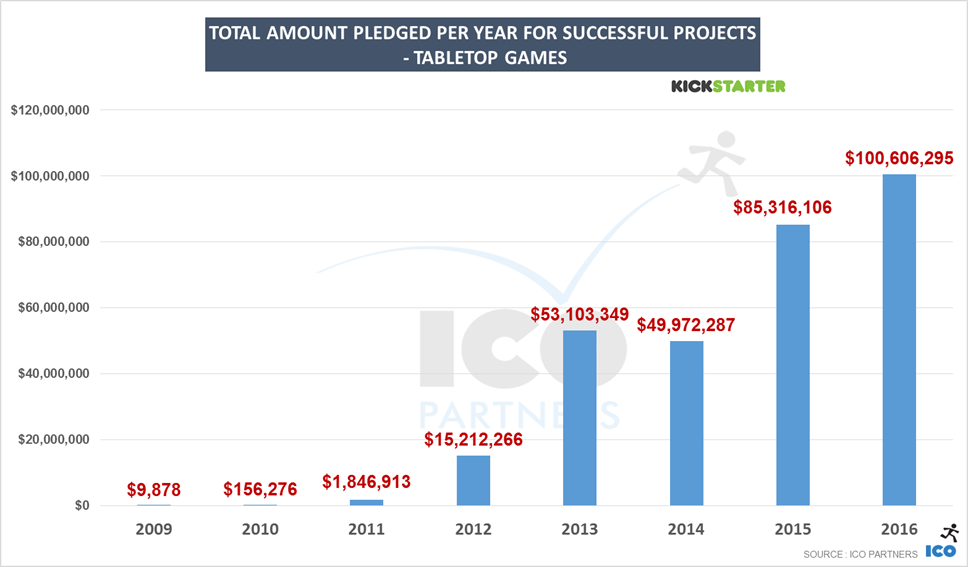
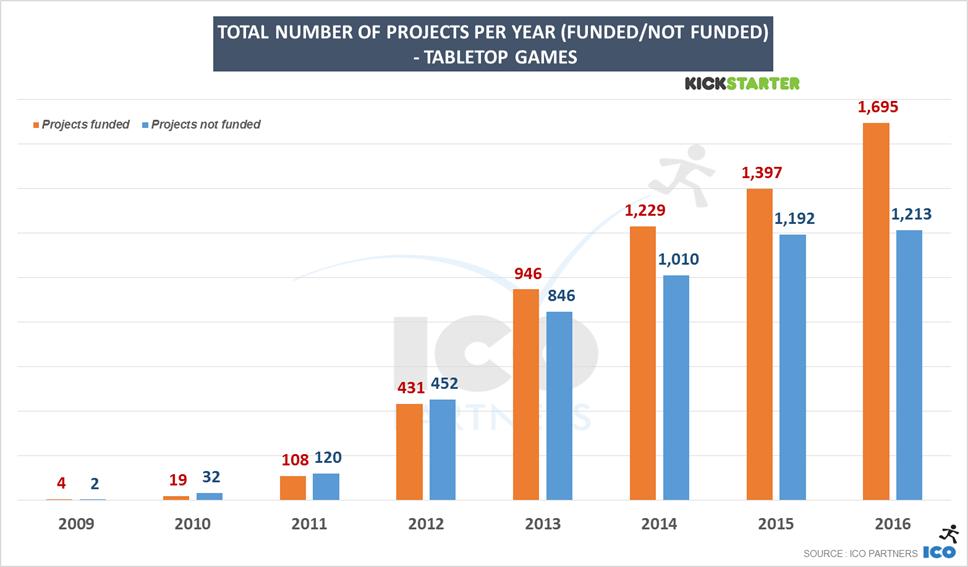
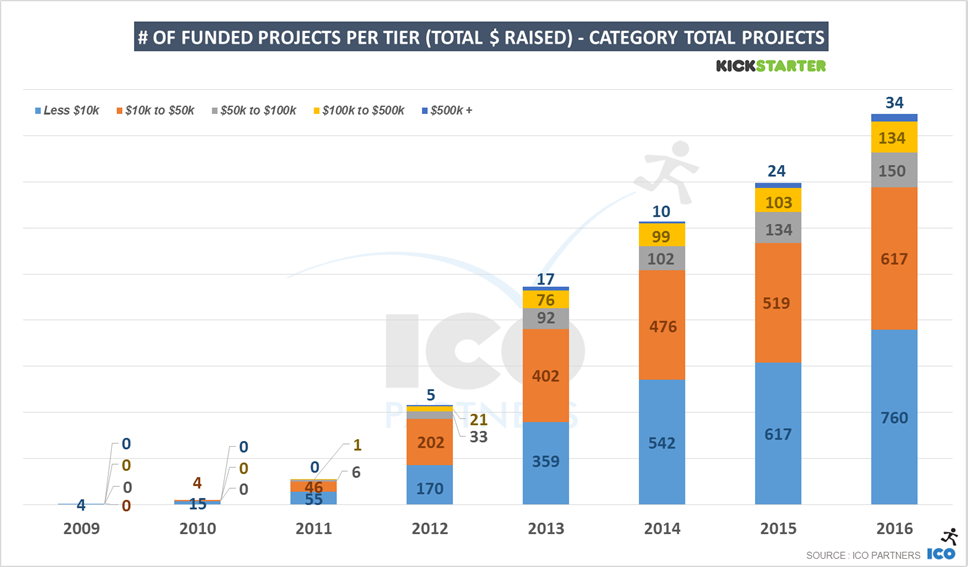
Over the years, Tabletop games have become the crown jewel of the Games category on Kickstarter. More projects got funded (+21%) for a larger total amount of money (+18%) than in the previous year, with more than $100m pledged to successful projects.
Recently, in a Polygon article about the upcoming PAX unplugged, the ICV2 estimate of $1.2bn for the size of the tabletop North American market was mentioned. If we estimate the market has grown a bit since that estimate, say $1.4bn, and if North America represents 45% of that market (making up numbers here, just for the thought exercise), that’s a $3.1bn global market. With $100m a year on Kickstarter, that’s 3% of the whole market transaction happening solely through Kickstarter. My estimates are of course very shaky, but they’re not totally unrealistic. That percentage is likely to be even higher when considering purely the North American market, which has historically been more culturally friendly to crowdfunding.
In the tabletop games industry, Kickstarter is not only the primary platform for crowdfunding, but is also now a key actor to the whole ecosystem.
There was more money and more funded projects across all the different tiers in 2016. Interestingly, compared to video games, the lowest tier (under $10,000) grew 32% in the total amount of money raised.
The most significant change is for the $100,000 to $500,000 tier again. More funded projects (+30% with +31 projects) and more money raised (+39%), the average per project in that tier increased to $216,000. Again, this can be seen as a result of a more professional approach to the way the campaigns are managed.
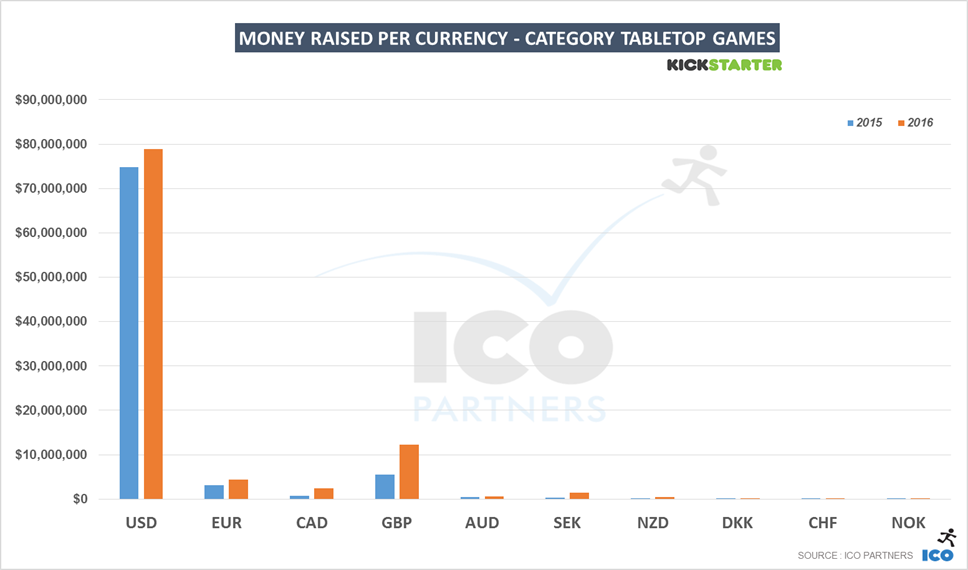
The biggest relative increase this year was for the GBP projects, more than doubling the amount raised year-on-year, and this despite the currency taking a nosedive in the second half of the year due to the Brexit referendum results.
The USD projects are still largely dominating though, representing almost 80% of the total amount of money raised.
There seems to be a lot of growth potential for European tabletop projects on Kickstarter, especially considering the cultural importance of the region for the tabletop games business. The lower numbers at present might also be due to local crowdfunding platforms performing particularly well. For instance, Blackbook Edition, that runs its own crowdfunding platform for tabletop roleplaying games in French, has raised $1m in 2016 alone.
Compared to the relatively even and stable video games chart, it is very clear that the Tabletop Games category has steady growth in the number of projects that get funded each week.
Finally, at the beginning of the year, and thus not showing in any of the data present, the largest Games campaign ever funded on Kickstarter ended, raising a staggering $12.3m. Alone, it raised about 12% of what all Tabletop games raised in 2016. That was on January 7th. I feel very confident that 2017 will again be a record year for Tabletop Games on Kickstarter.
https://icopartners.com/newblog/wp-content/uploads/2014/03/kickstarter_header.png256710Thomas BIDAUXhttps://icopartners.com/newblog/wp-content/uploads/2020/04/CRUSHCREATIVE_ICO_BRANDING_LOGO_NavyWhite-01-e1586189748878.pngThomas BIDAUX2017-01-31 16:26:232017-02-03 09:50:55Kickstarter in 2016 - Deep dive into the Games category
As has become the tradition, I have made a deep dive into the Kickstarter data we collect so I can present to you a review of the past year for the crowdfunding platform.
For the readers used to my focus on games, this is my one article a year where I actually widen the scope of the research, I will follow it up with an article specifically on games next week (and if you can’t wait, you can go read my article on GI.biz I wrote on the topic of crowdfunding in 2016). If you have a curious mind, you can check last year’s post, but I will do a lot of year-on-year comparisons here.
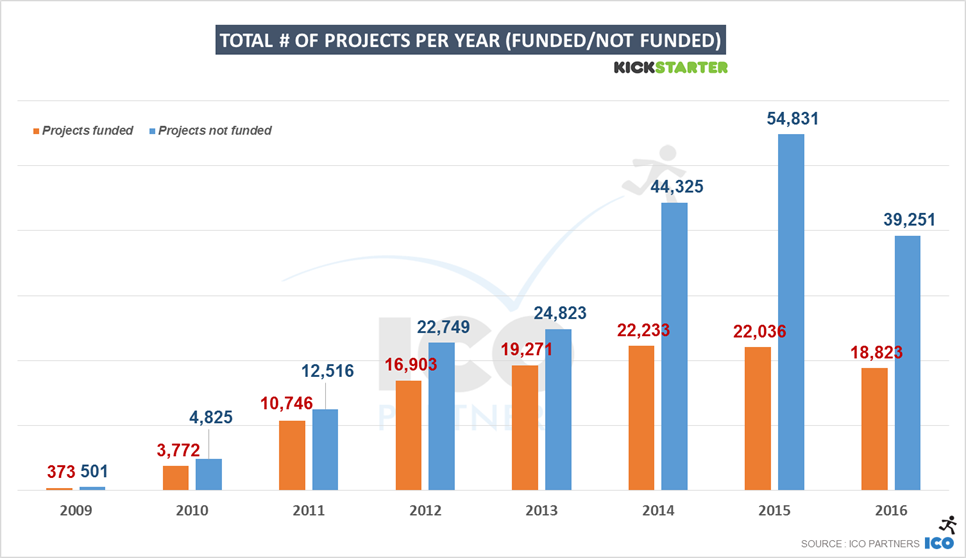
First year of decline for Kickstarter
After many years of constant growth, for the first time Kickstarter saw a decline last year.
It would be very hard for me, with the limited data set available, to fully explain why. As I am only looking at Kickstarter, I can’t tell if the decline is due to the enthusiasm of the early days of the platform wearing off, the competition eating into Kickstarter market shares, or crowdfunding building an image for unreliability and losing its wider appeal. I can however share my other findings, time will tell if this decline is a trend that will continue or if it will stabilise (a bit more on that later though as we have some indicators).
The first interesting point on the decline observed is the fact that the drop in the number of funded projects (- 14.5%) is much more significant than the drop in the total amount of money raised in the platform (-7%). That means there is a higher concentration of funding per project than in 2015 – if on average projects have raised more, but the platform saw an overall decline, it would seem to indicate that we might be heading towards either a more demanding audience (the quality of the campaigns need to reach a higher quality bar to meet its goal), or more professionally built campaigns are launched on the platform (raising more money and being more reliably successful), or more likely, a combination of both.
What is also noteworthy is that the drop in the number of projects is bigger (-31%) than the drop number of funded projects. This is certainly coming from a more general realisation that a Kickstarter campaign is not an easy money grab. We can see the percentage of projects getting $0 (my metric for “junk projects”) has dropped in the last year, from 20% of all the projects on Kickstarter in 2015 to 14% of all projects in 2016. This feeds nicely the idea that projects on Kickstarter are getting more professional or more serious overall.
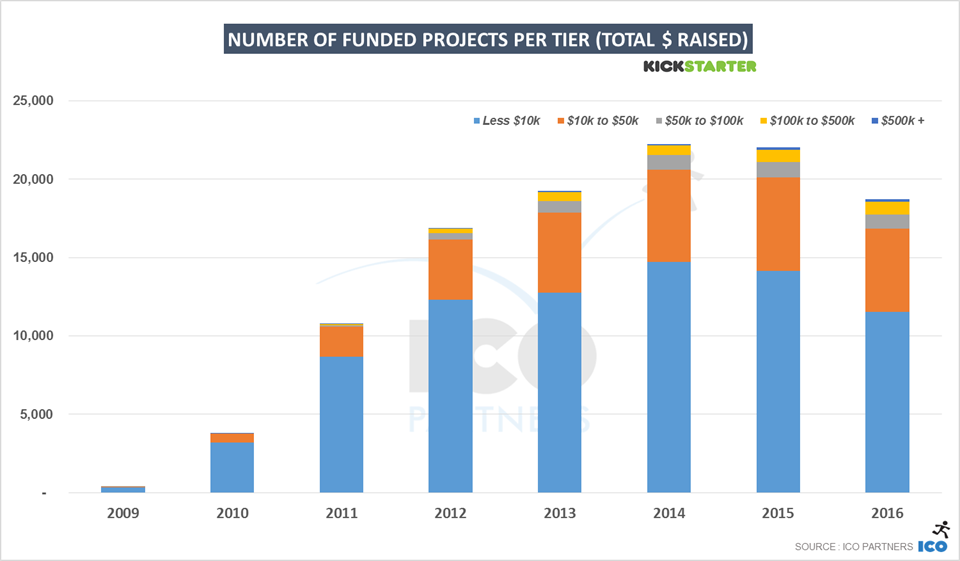
If you are not familiar with the format I usually use, the following graphs are showing the break down of projects based on the amount they have raised (in USD).
In terms of the number of funded projects, the biggest decline observed is for the lowest bracket, projects that raised less than $10,000. This group saw a -19% decline both in total number of funded projects and total amount of money raised by these projects. This is obviously not caused by more smaller projects managing to break through the higher bracket, but by the decline in the number funded projects for all the next brackets. Where we see an increase is in the number of funded projects in the brackets of “$100,000 to $500,000 raised” and “More than $500,000 raised”, despite the overall decline seen on the platform. There were more projects raising more than $100,000 in 2016 (978 projects) than any year prior. This is for me another sign of Kickstarter campaigns becoming more and more sophisticated and professional, and managing to raise more money than the prior years as a result.
If you have a particular interest in a specific category, you can find slides with detailed data for each one of them at the end of the article.
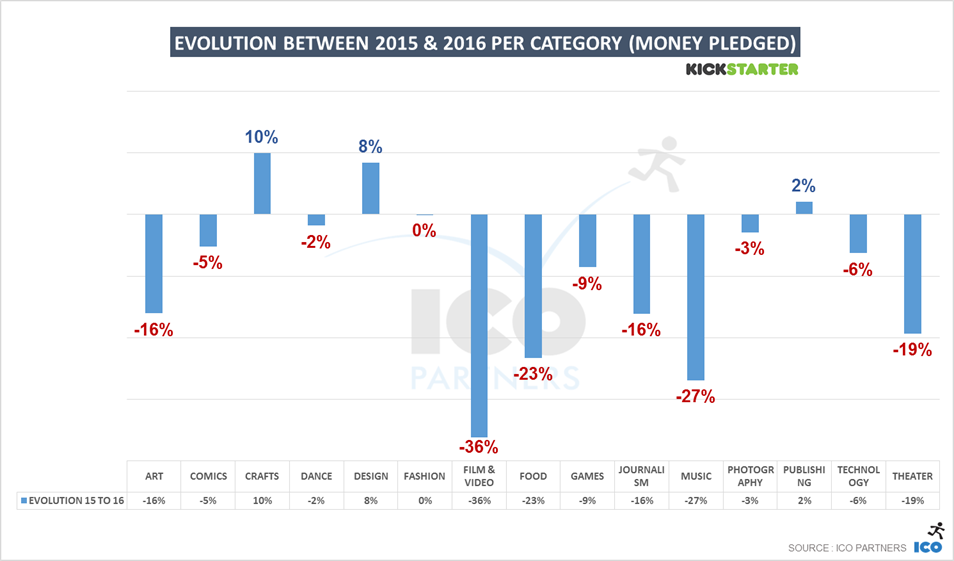
Looking how each category performed on the platform is always very interesting and says a lot to what happened on the platform. All the different categories exist in their ecosystem and microcosm, and the performance of one category could very easily contradict platform-wide trend.
In 2016, there are only 3 categories that saw a growth in the total amount of money raised: Crafts, Fashion and Publishing. Crafts is a very small category overall and as such, its performance is easily subject to variation. Publishing only saw a very small growth year-on-year (+2%), but this was only true for the total amount raised, as the number of funded projects declined (-4%). The only category that saw a proper growth in 2016 was the Design category, which grew +8% in total amount raised and +5% in the number of funded projects.
All the other categories raised less money in 2016 than in the previous year, but the decline is sharper for some. Both the Film & Video category and the Music category are leading the decline in terms of money raised. Interestingly, these two categories used to be the leading ones on Kickstarter (prior to 2014), and their continuous decline is probably the most worrying. It might be that they are creating a pattern that the other categories currently leading on Kickstarter will follow in the coming years, or they might be of a nature that makes it particularly easy for Kickstarter competitors to snatch market shares from them, or they might have an ecosystem that realised that crowdfunding wasn’t as needed as for other projects (specifically, I am personally thinking that both Films and Music have existing and very solid funding systems, while this is not necessarily true for other creative environments). As stated earlier, the data set I am looking at doesn’t provide a proper answer to this question.
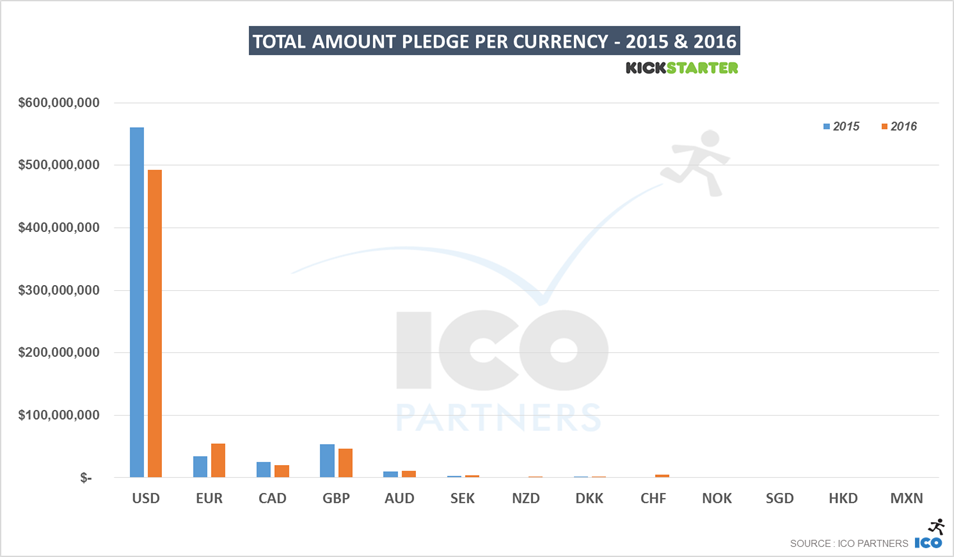
Looking at the currencies in which the projects are run, it is quite obvious that Kickstarter is still very much an American platform, even the EUR has now become the second currency in terms of total amount of money raised. EUR projects are still behind the GBP for the total number of funded projects though, highlighting the fact that EUR projects that decide to go on Kickstarter are probably ones that are ambitious and with a look to an international audience. I suspect many smaller projects (and more local projects) choose to go on other platforms that have been present locally for longer. This is still a win for Kickstarter in many ways as it managed to grow in a region where it has established competitors.
This is a stacked area graph showing the number of projects per week on Kickstarter, funded and not funded.
End of July/beginning of August 2014, something happened that boosted the number of projects launched on Kickstarter, but with little to no impact on the number funded projects on the platform. I have only very little evidence of this, but I think this was all due to the Potato Salad campaign. It was heavily talked about in the media and it painted Kickstarter as a platform where money was easy to raise. Certainly if a guy can get $55,000 for a potato salad, my own awesome project should be very easy to fund. The reality is of course much more harsh, but Kickstarter could see the effect on its number of project for 18 months. This flood of projects might have also had a negative impact on Kickstarter’s image, and the fact that there are fewer overall projects submitted might not be such a bad thing for them.
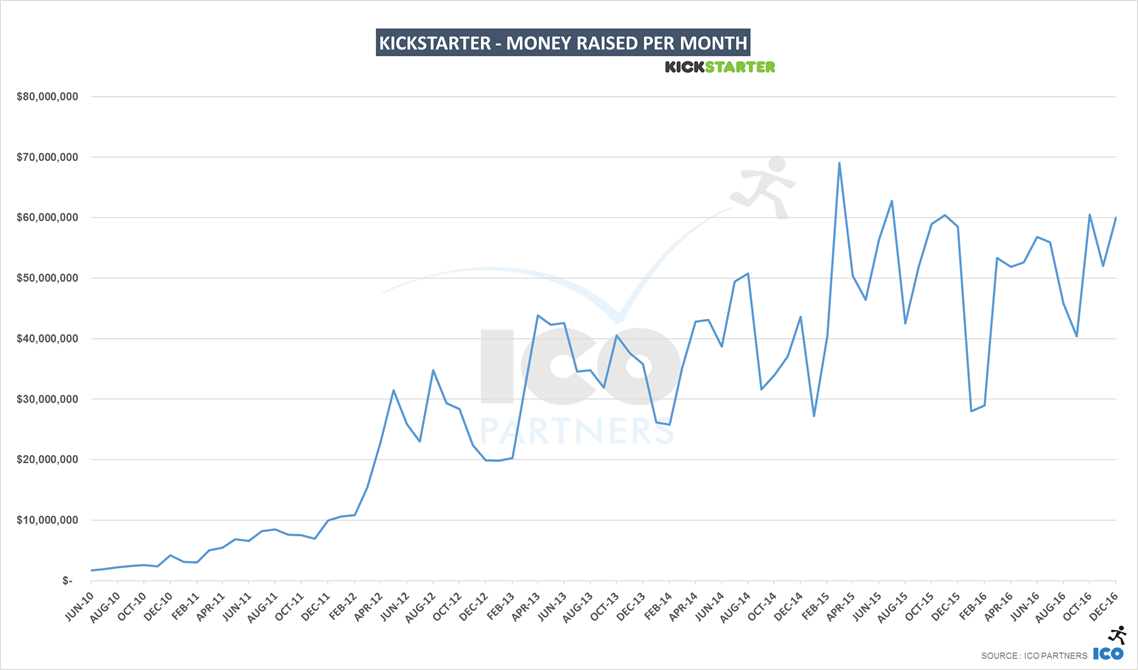
Finally, to conclude my analysis of the past year on Kickstarter, I wanted to share a more granular graph of the evolution of the performance of the platform over time. Looking at the amount of raised every month, last year decline doesn’t appear as a phenomenon that goes on worsening. February 2016 was the one month with a particular decline compared to the previous year and bears most of the year-on-year decline. So while there is also no hidden growth, this is the one set of data that makes me feel relatively optimistic that we are not seeing a bubble bursting, and I have very much in mind a very interesting talk from David Edery at GDC in 2010 on video games platforms, and the pattern he observed where some of them go through an “inevitable misery” decline before a “triumphant return”.
A look at the categories
Kickstarter asks creators to put their projects in different categories. This allows us to look at the different trends of each of those categories. While you can find a lot more details in the documents on Slideshare, I have summarized some key takeaways for each of them below.
Art
There was a significant decline in the total number of projects funded. Interestingly though, most of the drop in the money raised was on GBP and EUR project, there was a slight growth of the money raised in USD by contrast.
Crafts
A relatively small category, it was still growing this year. The number of projects that raised more than $50,000 went from 3 to 9.
Comics
The money raised in that category saw a small drop (-5%) year-on-year, but 2016 is still the second best year ever for that category. It is interesting to note there were no $500,000+ project this year and the total number of funded projects grew +9%.
Dance
While the amount of money raised has been comparable to 2015 (+3%), the number of funded projects dropped by -12%. But more interestingly, the number of projects launched dropped by a whooping -30%. [loss of KS zeitgeist?].
Design
After a stellar growth in 2015, the Design category is one of the few that kept growing in 2016. The growth happened mostly with non-USD project (the total amount raised for USD projects declined a bit in 2016), especially with the EUR projects, following the trend observed last year. Like for most categories, the total number of projects launched on the platform declined, even though more projects got funded in the end.
Fashion
The Fashion category is very stable year-on-year. Almost the same amount of money was raised, even if a fewer number of projects got funded (-11%). This was the first year where 4 Fashion projects raised more than $500,000, helping maintaining the total amount raised.
Film & Video
2016 wasn’t great for this category. In terms of total of money raised, it dropped below the level of 2012 (-38% from 2015’s amount). The number of funded projects also saw a significant drop from last year (-25%). The decline is seen at all Tiers of funding. Small or big, there were fewer Films funded on Kickstarter in 2016. The one subcategory that saw a significant increase is the Animation subcategory, where $3.6m were raised in 2016 compared to $1.8m in 2015.
Food
The Food category dropped below the $20m per year mark in 2016, with a sharp decline of the number of funded projects (-32%). Projects in EUR were some of the few that saw growth from the previous year, raising more money in total than the British and the Canadian projects.
Games
Like last year, I will do a deeper dive into this category next week. For now, I will note that following the trend, less money was raised in this category than during the previous year. However, the total number of projects funded actually grew, and the decline in the total amount raised was mostly true for projects run in USD. Projects in EUR and GBP raised more money in 2016 than in 2015. The percentage of the projects seeking funding and getting in also grew to 37%, the best success ratio in that category since 2010.
Music
This category follows the same pattern as the Film & Video category: a significant decline for the 3rd year in a row. Both the total amount of money raised, 2016 was the worst performing year since 2011, but the total number of projects funded, it was the worst year since 2010. For the music genre, Country & Folk subcategory is #1 for money raised as well as for number of funded projects in 2016.
Photography
The category has been stable in terms of total amount of money raised, mostly thanks to 2 projects raising more than $500,000, as the total number of funded projects here again saw a decline (-15%).
Journalism
This is still a small category, and while it also saw a decline in both the total amount raised and the total number of funded projects, this was also the very first time Kickstarter had projects raised more than $100,000 in that category. And it wasn’t just one project, but four of them, highlighting one of this year’s trends that a significant part of the decline on Kickstarter is affecting the smaller projects on the platform.
Publishing
Like last year, there was a slight drop in this category’s total number of funded projects, however, the total amount of money raised did see an increase (+4%). All that growth came through projects in EUR and… in AUS (Australian Dollars)! Like for many categories, the drop in the number of projects launched on the platform has declined way more (-28%) than the decline in the number of funded projects (-4%).
Technology
After a stellar year in 2015, the Technology category saw a small decline in the total amount of money raised (-1.5%), and a more significant decline in the number of funded projects (-18%). Again, this comes with an even bigger decline in the total number of projects submitted on the platform (-28%). The one axis of year-on-year growth was for projects in EUR, which was the second currency on the platform, raising more money than projects in GBP for the first time. Also interesting to note was the growth of the Wearable subcategory (+11% money raised).
Theatre
A fairly small category that last year dropped to its lowest amount of money raised since 2011. In 2016 the decline continued, with this time even fewer projects getting funded than in 2011. And once again, the one area of growth was with projects in EUR, that raised more money than in 2015.
Like for all previous blog posts on the topic, we have been using the data on the Kickstarter pages themselves (with the help of Potion of Wit) and the collection method is not without its own issues. Please consider all of the numbers presented here as estimates.
https://icopartners.com/newblog/wp-content/uploads/2014/03/kickstarter_header.png256710Thomas BIDAUXhttps://icopartners.com/newblog/wp-content/uploads/2020/04/CRUSHCREATIVE_ICO_BRANDING_LOGO_NavyWhite-01-e1586189748878.pngThomas BIDAUX2017-01-25 14:21:142017-01-25 14:21:14Kickstarter in 2016 - Year in review