
Before January is out, here is the annual look at Kickstarter for the year 2017. Where is Kickstarter going?
Overall funding bounces back
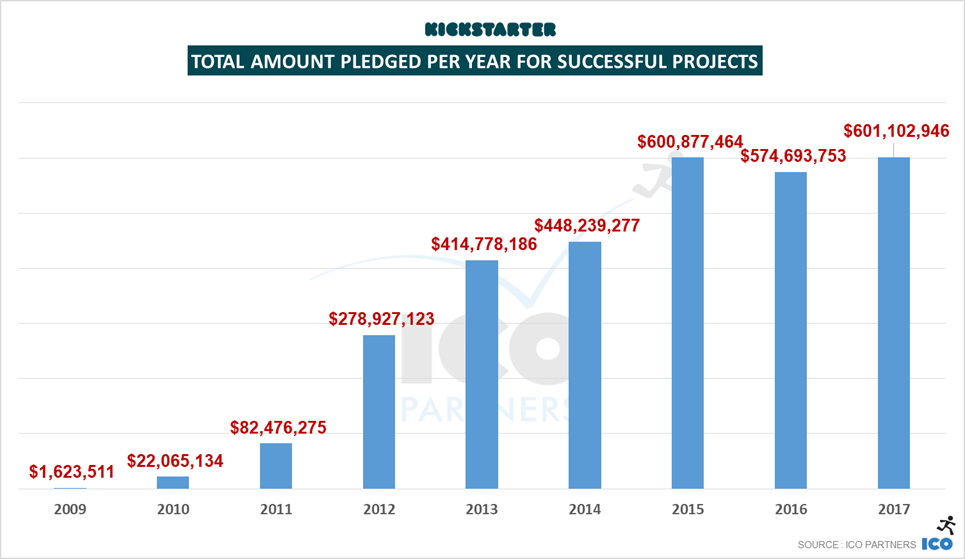
After its very first year of decline in funding of projects in 2016, Kickstarter sees a bounce back in the overall money actually raised.
That bounce is very timid though, even if it is enough to make 2017 the best year ever for the platform, this is a 0.03% increase from 2015, the previous record holder.
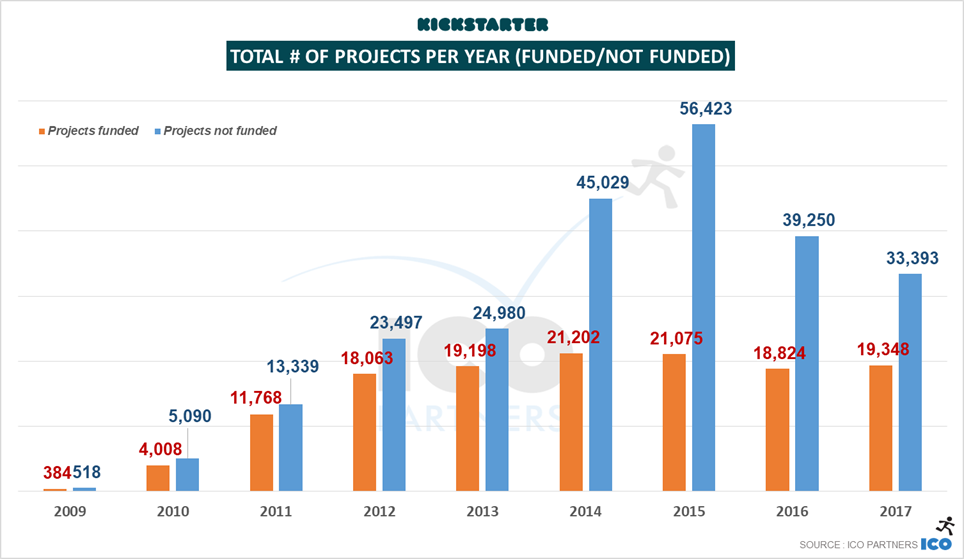
The number of funded projects doesn’t break the record though (from 2014), but it sees an increase from 2016 still.
What is remarkable though, is the number of projects submitted to the platform is still stumbling down, almost 6,000 fewer projects than the previous year, a -15% drop.
More funded projects, fewer projects overall, obviously the “success ratio” is looking better in 2017 than it has in a while.

Alongside the success ratio, we observed a drop in the ratio of project that raise $0 (also called the junk ratio). We are probably seeing the tail-end of the Potato Salad Effect.
Record breaking number of projects raising more than $100,000
If you are not familiar with the format I usually use, the following graphs are showing the breakdown of projects based on the amount they have raised (in USD).


Looking at the size of projects per tiers, there were more projects in all the funding tiers except the top ones. Even with fewer $500k+ projects than in 2016, there was more money raised on Kickstarter.
This comes from a record number of projects raising between $100k and $500k, and a sign of positive growth for the platform.
For the first time, in 2017, there were more than 1,000 projects raising more than $100,000.
Growth is almost coming all from the Games category
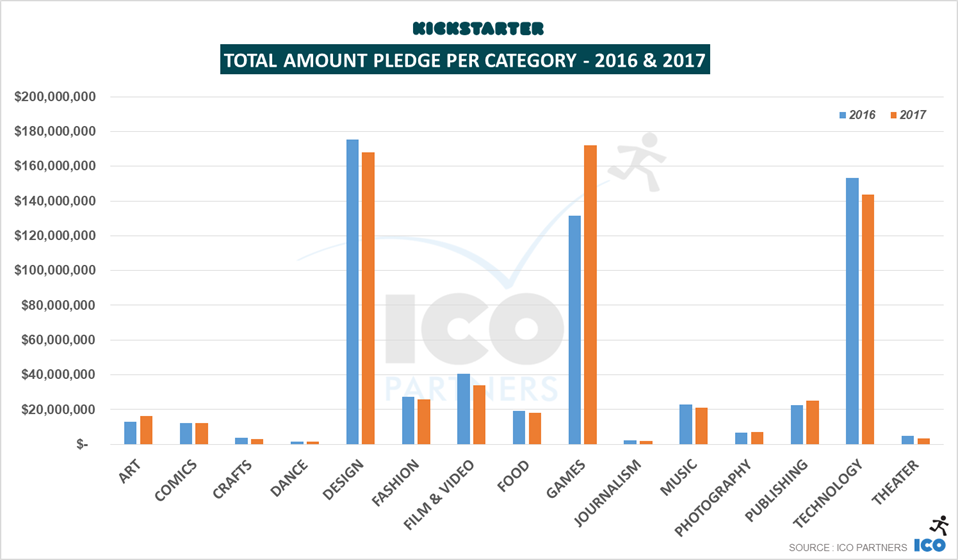
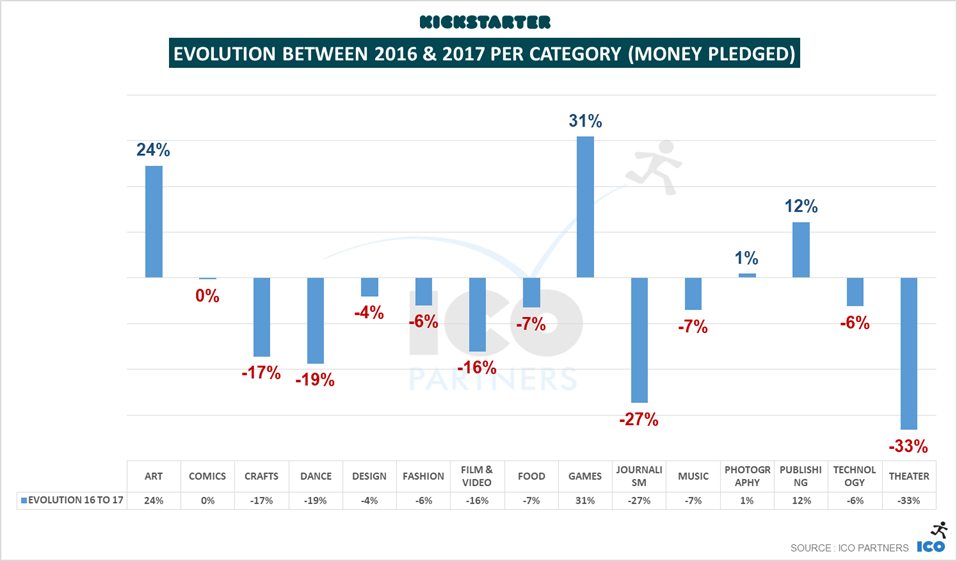
Looking at the categories in more detail, we can see that the growth observed in the amount of money raised is almost entirely coming from the Games category.
All other categories saw some declined in the amount of money raised, with the exception of Art, Photography and Publishing, respectively 2.5%, 1% and 3.8% of all the money pledged, where Games are now 26% of that amount.
Of course, the top three categories are still Design, Games and Technology, representing together 74% of all the money pledged in 2017. But this is the first time that the Games category takes the top spot.
Growth driven by non-US projects
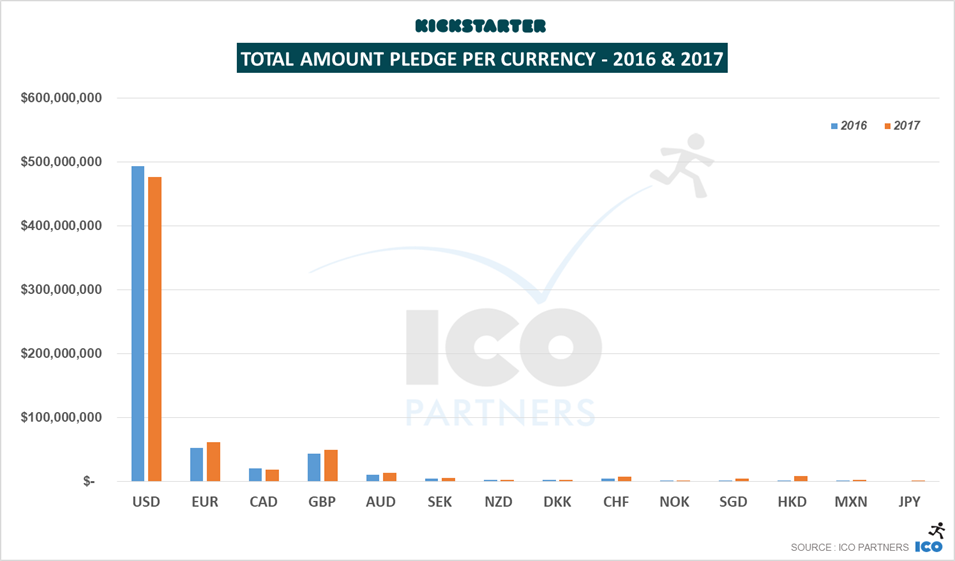

There was more money raised across all currencies in the past year, except for the USD and CAD. Most of the of the money is raised in USD still, but since Kickstarter was launched in Europe, the total amount of money raised in EUR has grown every year, making it the 2nd ranking currency on the platform and representing almost 10% of all the money pledged.
A look at the categories
Kickstarter asks creators to put their projects in different categories. This allows us to look at the different trends of each of those categories. While you can find a lot more details in the documents on Slideshare, I have summarized some key takeaways for each of them below.
As usual, a dedicated blog post on the Games category will come soon.
Art
A record breaking year for Art. It passes the bar of $14m raised for the first time, including $2m raised by projects in GBP.
A significant growth in the number of projects that got funded as well, +24% compared to 2016.
Crafts
A relatively small category, the money raised by it dropped below $2,5m in total, while the number of funded projects grew a little bit. 25% of the money raised was done by projects in GBP.
Comics
The total amount of money raised in the category stayed about the same, but the number of funded project grew, and it has seen a constant growth for the past 6 years. There were more Comics projects funded than ever before in 2017.
Dance
Another small category, the amount of money raised and the number of funded projects are at their lowest since 2011.
Design
After constant growth in the past few years, in 2017, the category saw its first dip, albeit a small one (-2.5%).
On the other hand, the number of funded projects is still growing, and across all tiers of funding, except the $500k+ tier which had the same number of funded projects it had in 2016 (55 projects).
Also noteworthy, projects in EUR represented 14% of the money pledged in the category, up from 8.5% in 2016.
More funded projects but less money raised overall, the Design category illustrates very well the 2017 trend.
Fashion
The Fashion category saw a small decline in the amount of money raised, and a significant growth in the number of funded projects (best year to date).
Projects in EUR represented 16% of the money pledged last year, another category where projects in EUR grew in their shares of the category.
Film & Video
Once the poster child of Kickstarter, the category has been in decline for the past 4 years, with 2017 at record low levels.
The amount of money pledged has almost halved in two years and the number of funded projects is the lowest since 2011.
Two notable subcategories saw an increase in the amount of money raised, though: Documentaries and Animation.
Food
The Food category saw a small drop in the number of funded projects and the total amount of money raised, but it remained at a stable level from the previous year.
Games
Like last year, I will do a deeper dive into this category soon.
To note though, the vast majority of the growth observed in the category is coming from the Tabletop Games subcategory (more than 2,000 projects funded in 2017).
Music
The other former crown jewel of the platform, along with Film & Video, that is seeing a constant decline over the past 5 years. The decline is both significant on the financial side and the amount of money raised. The total number of projects that achieved funding was at 2,200 in 2017, down from more than 5,000 funded projects in 2012.
Photography
The category has been stable in terms of total amount of money raised, as the total number of funded projects here saw a decline for a second year. It is interesting to note though that the amount of money raised by projects in EUR has doubled year-on-year.
Journalism
This is still a small category. It saw a decline in both the total amount raised and the total number of funded projects for the second year in a row. However, the amount raised by projects in EUR and GBP has increased significantly, both representing almost 14% of the total of money raised.
Publishing
This was a year of growth for this category, on all fronts, money raised as well as number of funded projects. The growth was across projects in USD, GBP and EUR. Children’s Books is again the top subcategory.
Technology
Another year with a small decline of the money raised and number of funded projects for the category, even for projects in EUR.
Theatre
A fairly small category that continued its decline. It dropped to its lowest amount of money raised and number of funded projects since 2010 (when Kickstarter was just a year old).
Concluding words
2017 was not the best year for Kickstarter, but it still maintained a good level of funding. The good news is evident when you look at the number of projects that are funded on the platform. These are quite stable, and even growing in some categories, but the number of projects submitted to the platform are also going down. I believe that Kickstarter has suffered from the fact that many low-quality projects have been creating noise, presenting an image of a platform where “bad” projects are welcome. The fact that the number of junk projects is going down can only help the platform.
I have concerns though on how the communication of the platform hasn’t adapted to its new paradigm. It wants to be this platform for cultural projects, but films and music projects are becoming rarer, and it is not addressing the fact that games, especially tabletop games, along with design and technology projects, are what the platform is now about.
I am not suggesting to ignore its cultural roots, but very little has been done to improve the way the platform supports the current top categories. And the same could be said about the lack of features developed to support the expansion of the platform in non-English territories.
All the slides
A note on the methodology
Like for all previous blog posts on the topic, we have been using the data on the Kickstarter pages themselves (with the help of Potion of Wit) and the collection method is not without its own issues. Please consider all of the numbers presented here as estimates.


Trackbacks & Pingbacks
[…] is the tradition, this is the follow-up from the overall Kickstarter annual review from last week, with a focus on the Games category. Again, I will talk about Kickstarter, but I shared some […]
Leave a Reply
Want to join the discussion?Feel free to contribute!