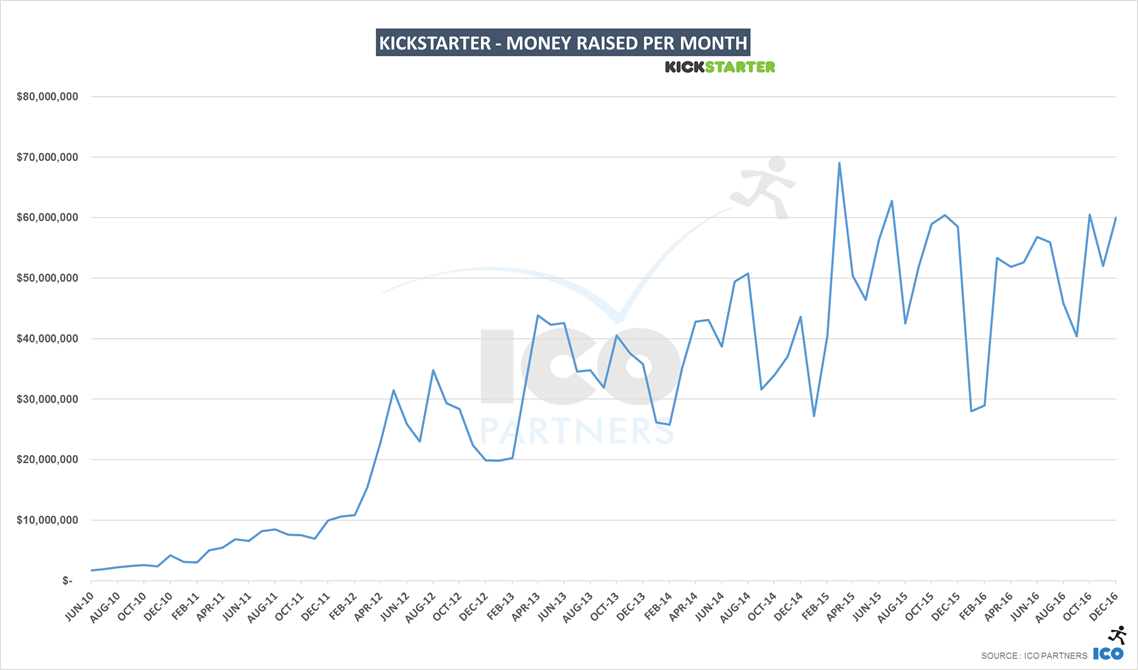
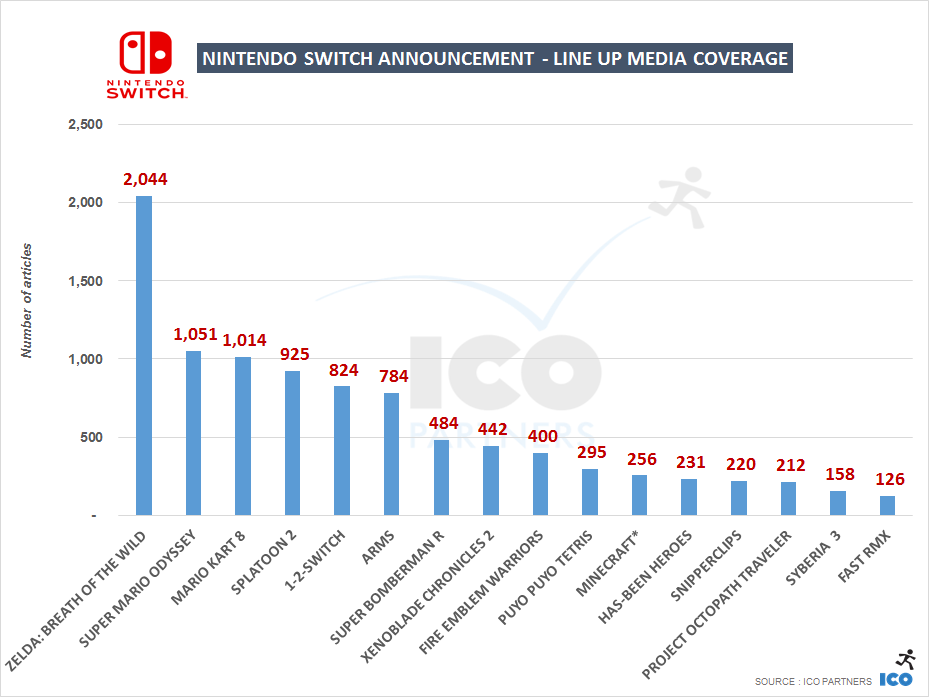
As promised last week, here is a deep dive into the Games category on Kickstarter for the year 2016. The format will follow the same as the article I did last year on the same topic. Please bear in mind that I will exclusively look at Kickstarter, and not any other crowdfunding platform here. For a more general outlook, specifically on video games, you can read my guest article on GamesIndustry.biz.

As usual, at the end of the article you can find more graphs in the dedicated SlideShare presentation.

The whole Games category

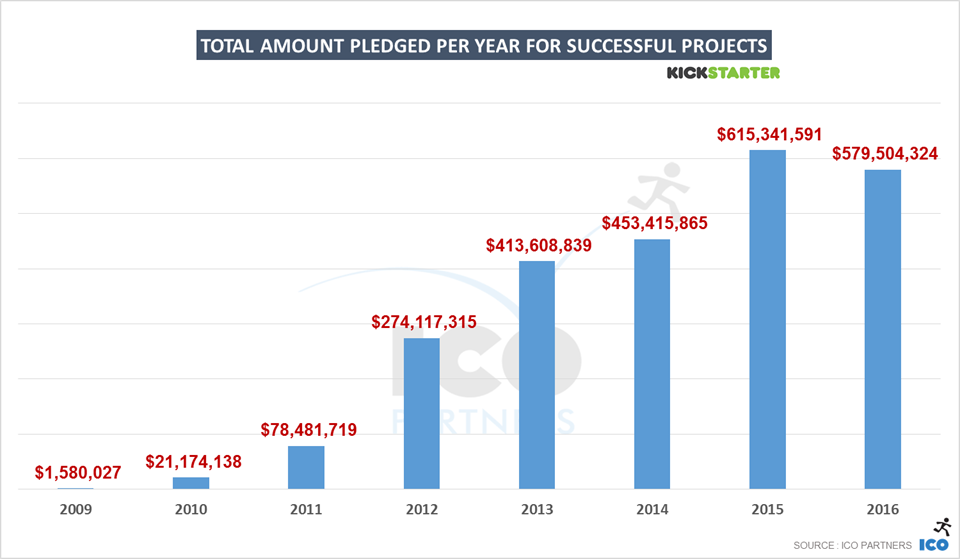
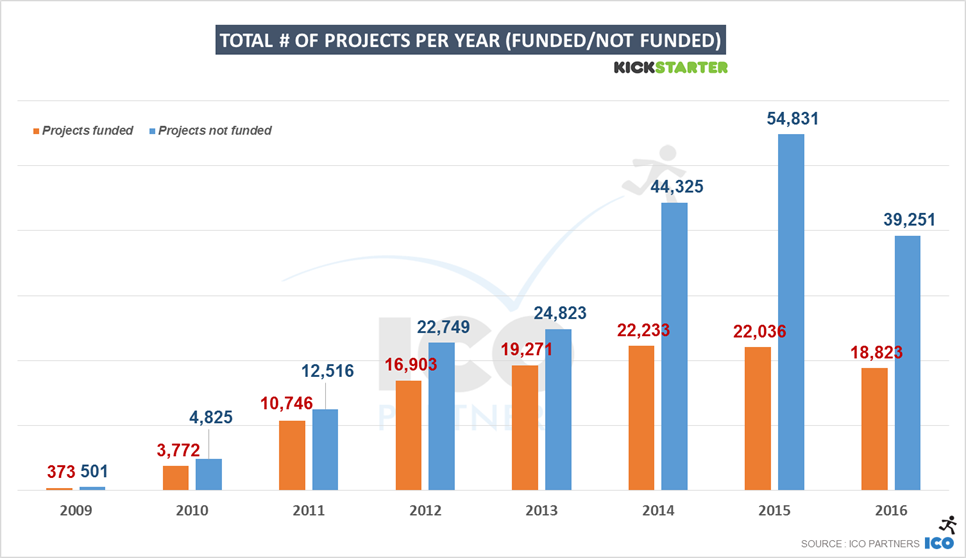
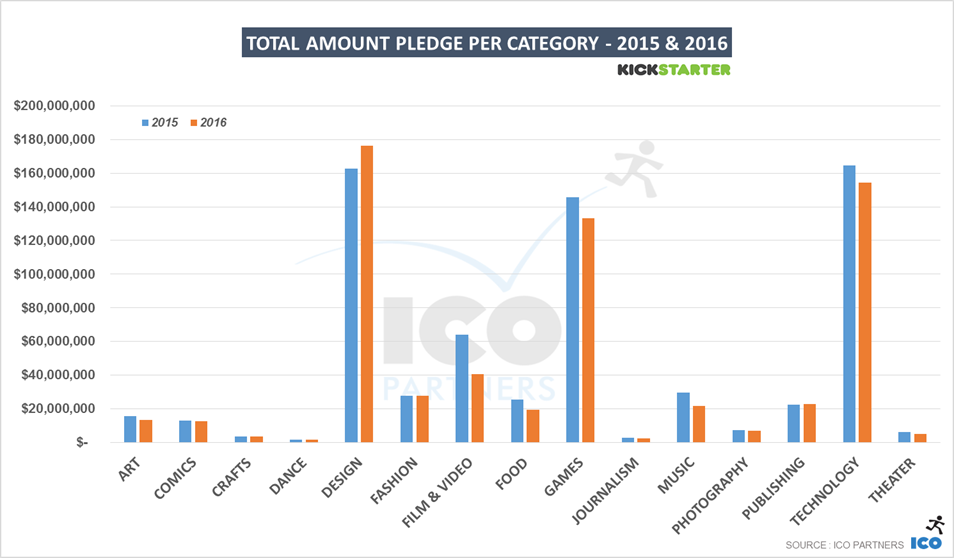
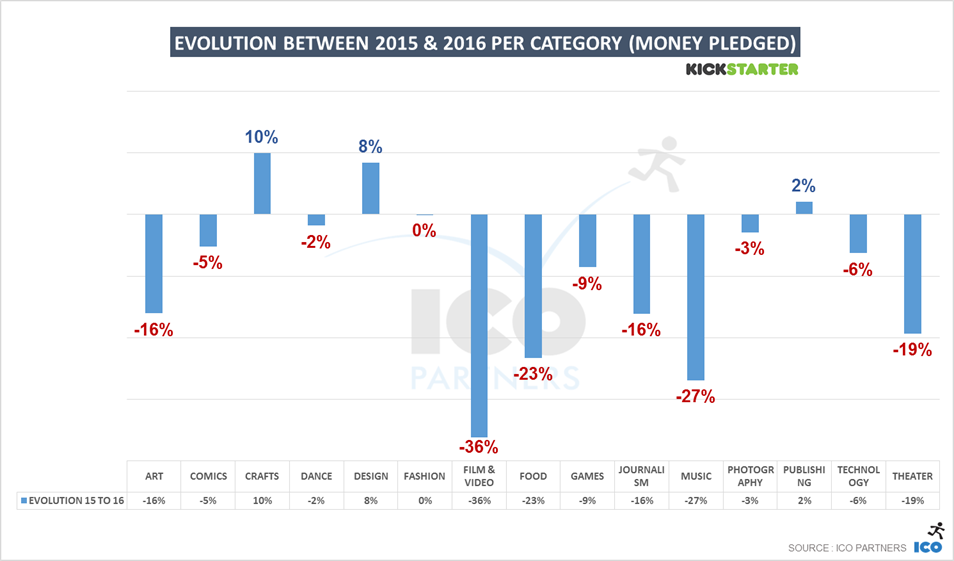
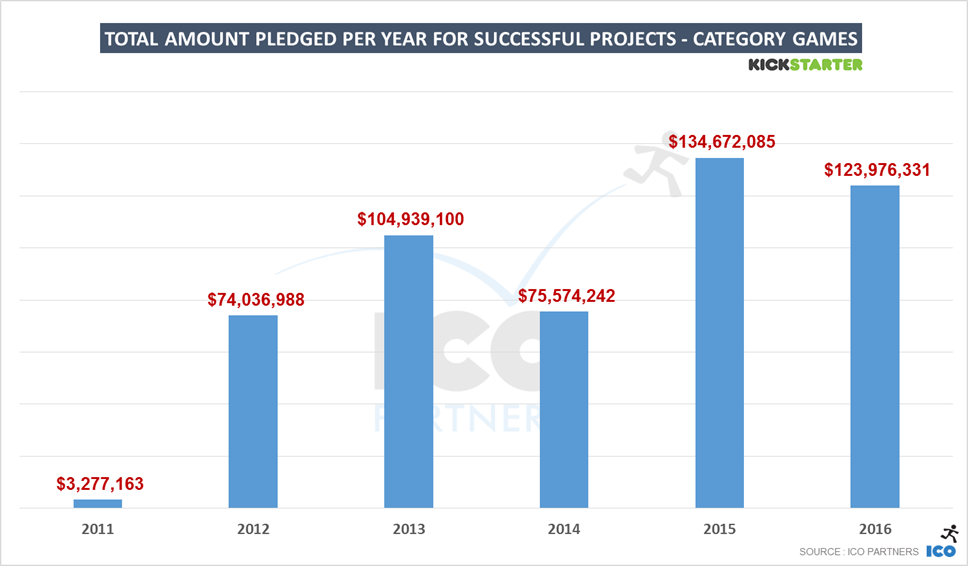
As seen last week, like most categories on Kickstarter, Games saw a decline in 2016 in money raised compared to 2015 (-8%). This is still the second biggest year on record in terms of money raised, and in fact, there were more projects funded in the category than ever before (+14%).

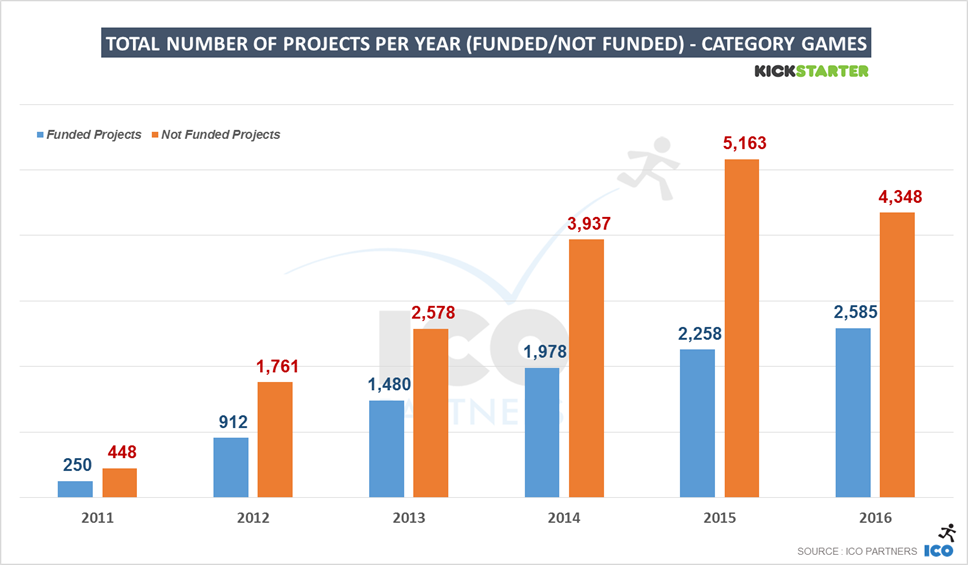
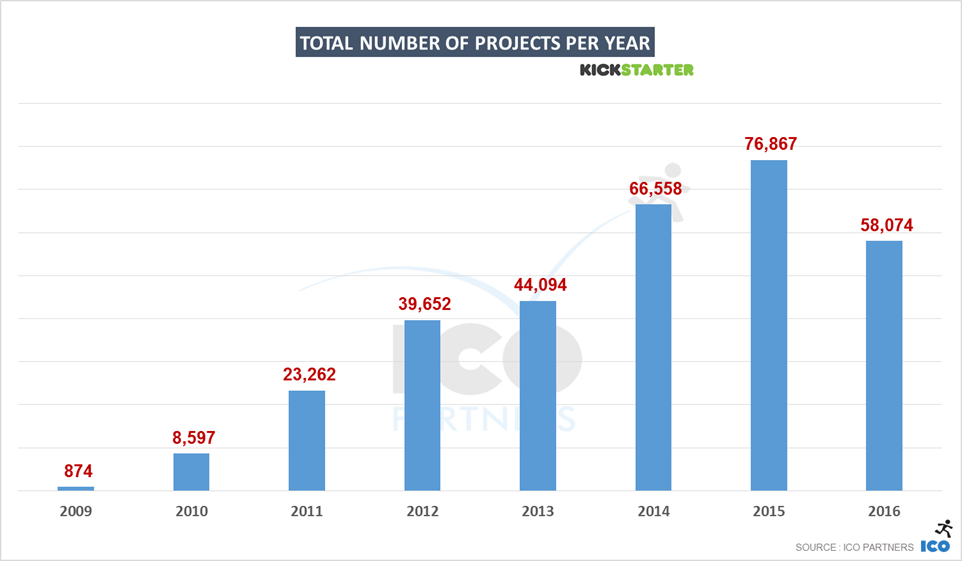
The growth in the number of funded projects however comes with a decline in the total number of projects seeking funding on the platform. Fewer projects on the platform, but more projects funded – the ratio of success is climbing. The platform is maturing, the general audience understanding of what it takes to get funded is getting more sophisticated.

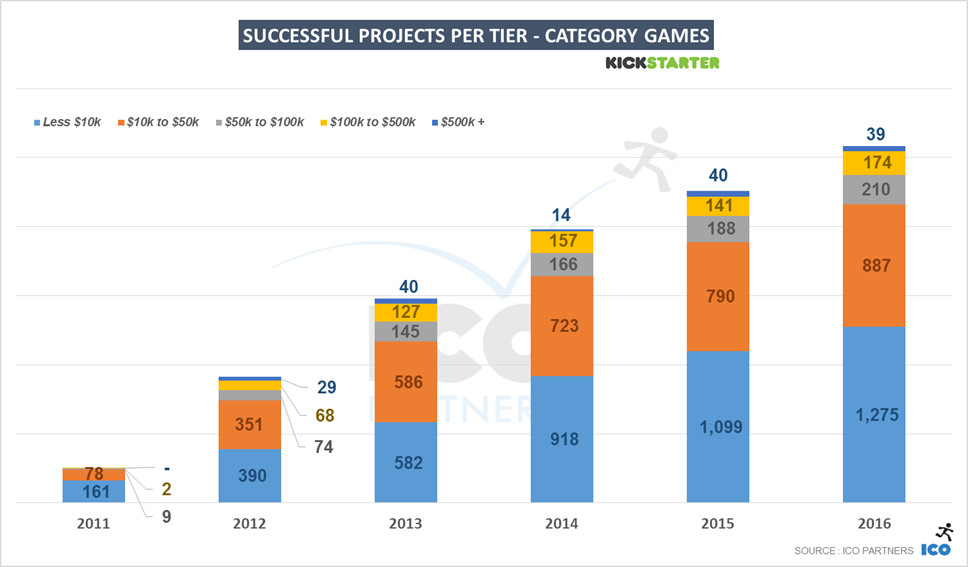
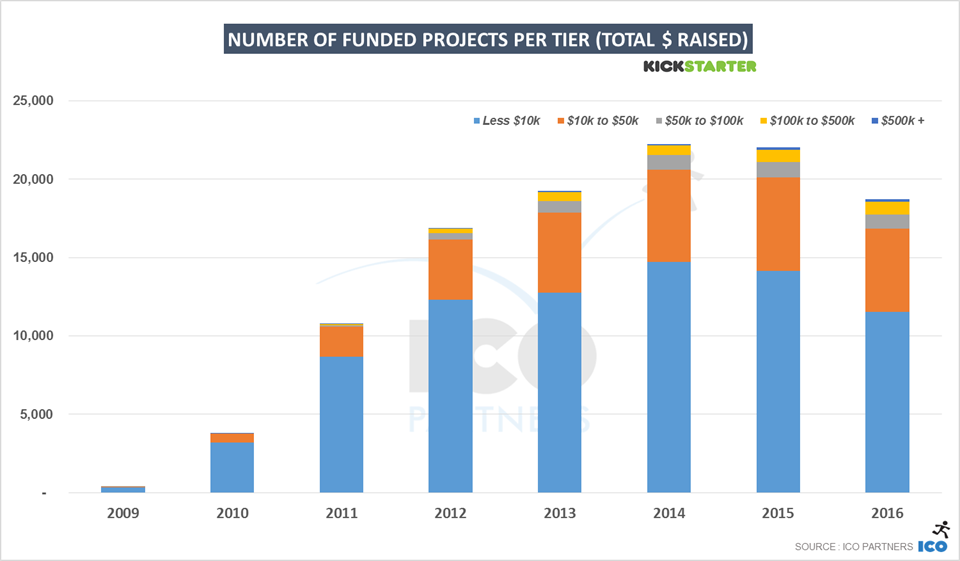
In terms of money, it’s interesting to observe that the overall year-on-year decline only happened at the highest tier, with the projects raising $500,000 and more. All other tiers showed growth (+18% across all those projects).

Interestingly, there were a similar increase in the number of funded projects across all tiers except for the highest tier. There was 1 less project funded in the highest tier (but considering there are fewer projects, that represents -2%). All the other tiers had at least +12% growth in the number of funded projects.

In both number of funded projects and money raised, the tier with the largest growth is the $100,000-$500,000 tier (respectively +23% and +27%). In last week’s blog post, the trends were interpreted as showing an increase in the professionalism of the campaigns on Kickstarter, and this again reinforces that sentiment.


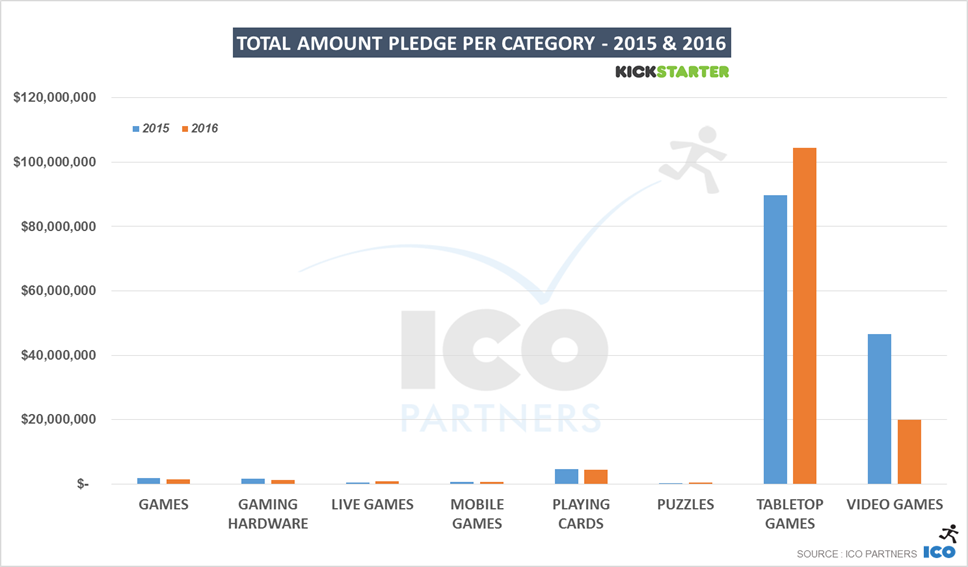
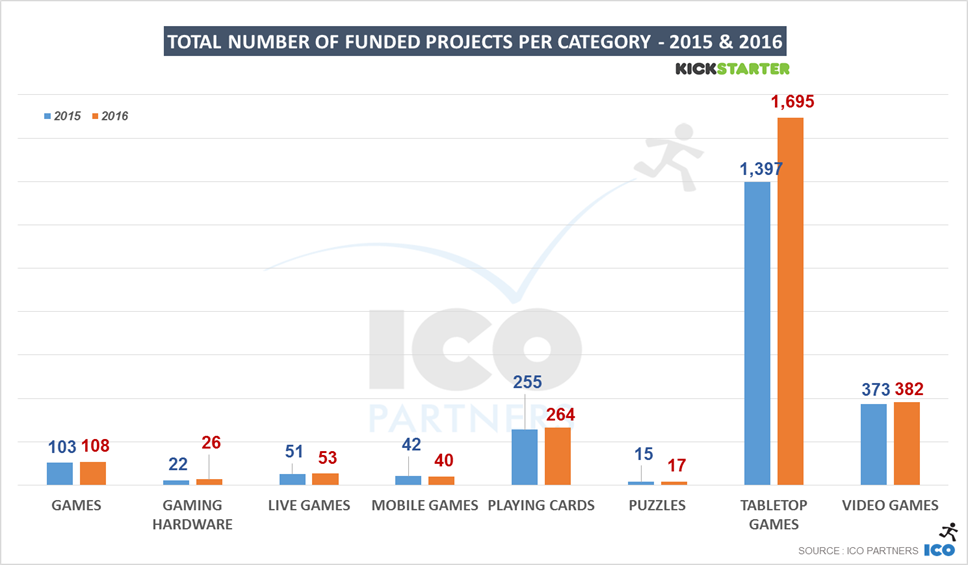
Like last year, there are two subcategories making up the most of the Games category: Tabletop Games and Video Games. All the other subcategories only account for 7% of the money raised and 30% of the funded projects.

Overall, most of the decline in the games category happened for the Video Games projects. Less money (-57%) and fewer funded projects (-13%) account for the difference from last year for the Game category.

Smaller Subcategories

Before getting into the two main actors of the Games category on Kickstarter, here are a few new insights on the smaller subcategories from 2016:

  • Games. This catch-all subcategory, meant to cover any project that the existing labels don’t properly represent, has declined again. I suspect this is more due to project creators opting more and more for existing subcategories, and hoping for success by association, than any actual revealing trend.
  • Gaming Hardware. The Ouya and the Oculus campaigns haven’t had many successors. In 2016, less than $800,000 was raised by 26 projects in this category. It’s not much when you consider that the Smach Z campaign alone raised more than $500,000 (the first project to manage to do so in this subcategory since 2013). A campaign ran in EUR, it also means that it was the leading currency platform for that subcategory, raising more money than all the other currencies combined.
  • Live Games. A niche subcategory, but growing every year. It more than doubled the money raised year-on-year, with only +4% more projects. For the first time, projects in this category raised more than $50,000 (3 projects in fact). No project managed to raise more than $100,000 yet, but the highest managed to reach $90,000 in funding, so it might be a threshold passed this year.
  • Mobile Games. I have a very strong opinion on Mobile Games and crowdfunding – I believe they are not meant to do well together. It doesn’t mean nothing is happening in this subcategory. 40 projects got funded, raising a total of $460,000 between them. Also, for the first time since the subcategory was added, a project raised more than $100,000 (this game) too. Surprisingly, the 2nd currency is AUD, with 4 funded projects that raised between them $64,000. Good job, Australia! (If you believe I’m being snarky, you might be onto something)
  • Playing Cards. The 3rd largest subcategory, it saw a small decline from last year in money raised (-2%) and small increase in the number of funded projects (+4%). This said, there were larger projects than ever before. The number of projects raising more than $100,000 went from 2 in 2015 to 5 in 2016.
  • Puzzles. The smallest of all the Games Subcategories, it had 17 projects funded last year, and together they raised $350,000, almost triple the amount from 2015. This is mainly thanks to the amazing Codex Silenda campaign, that raised $210,000 by itself – and would have raised much much more had the creator not been humble (and sane) and capped the number of items you could back. Seriously, check it out, it’s incredible.

And now, to the main contenders.

Video Games


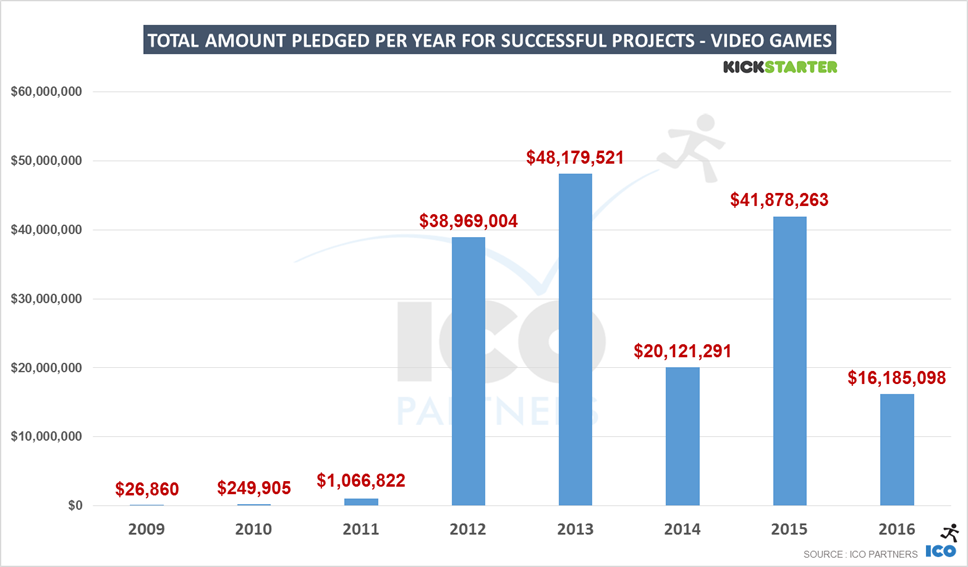
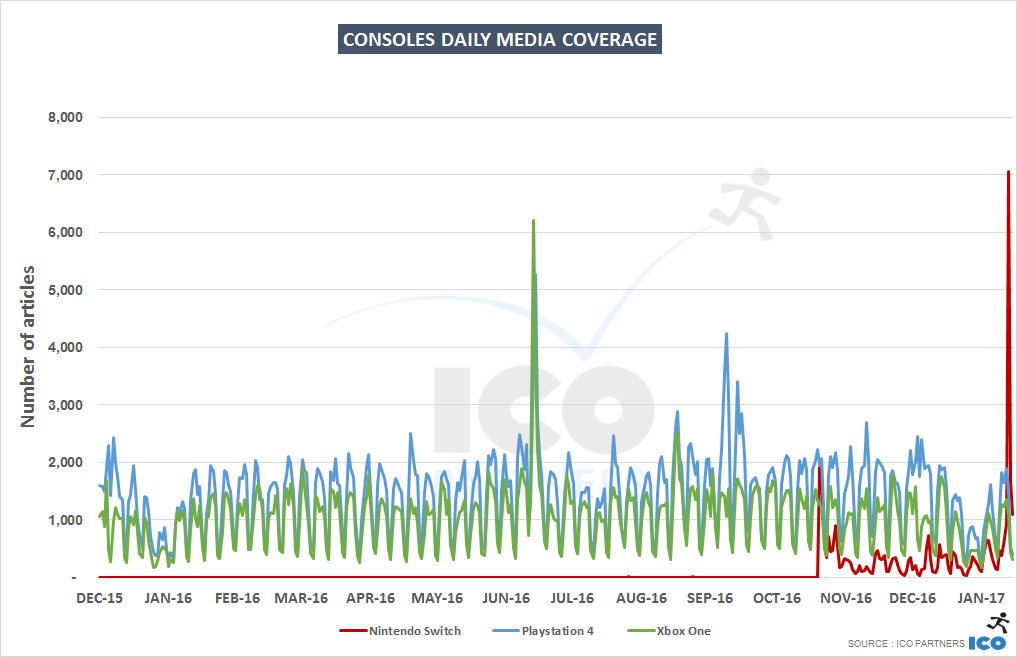
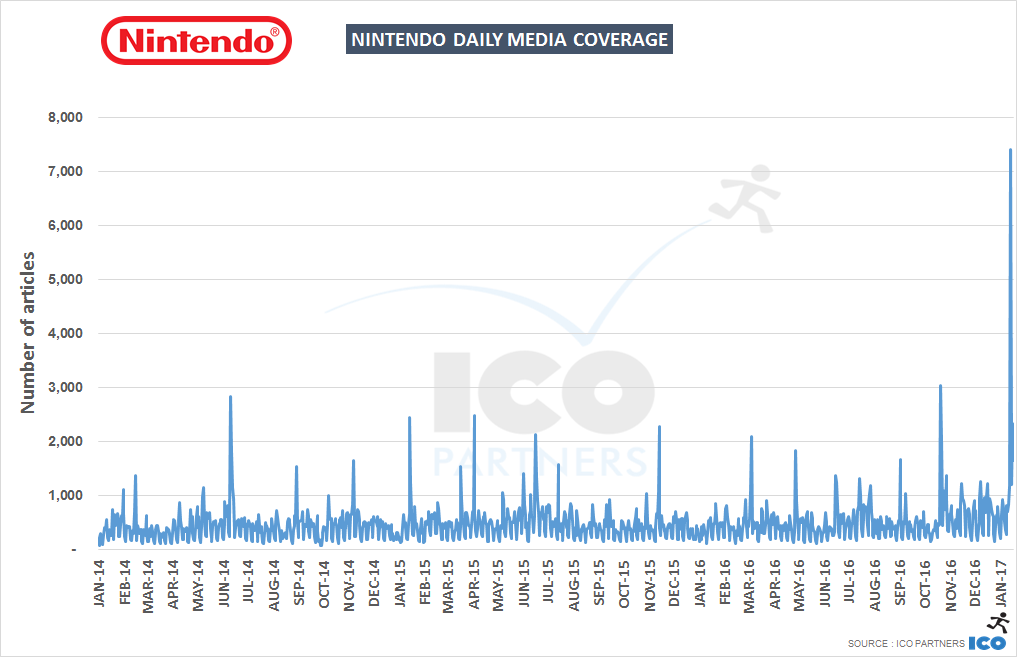
There is no ignoring the significant drop in the total amount of money raised for video games in 2016. With $16m, this is the lowest raised on the platform for this category since it exploded in 2012 after the initial funding of The Broken Age by Double Fine.

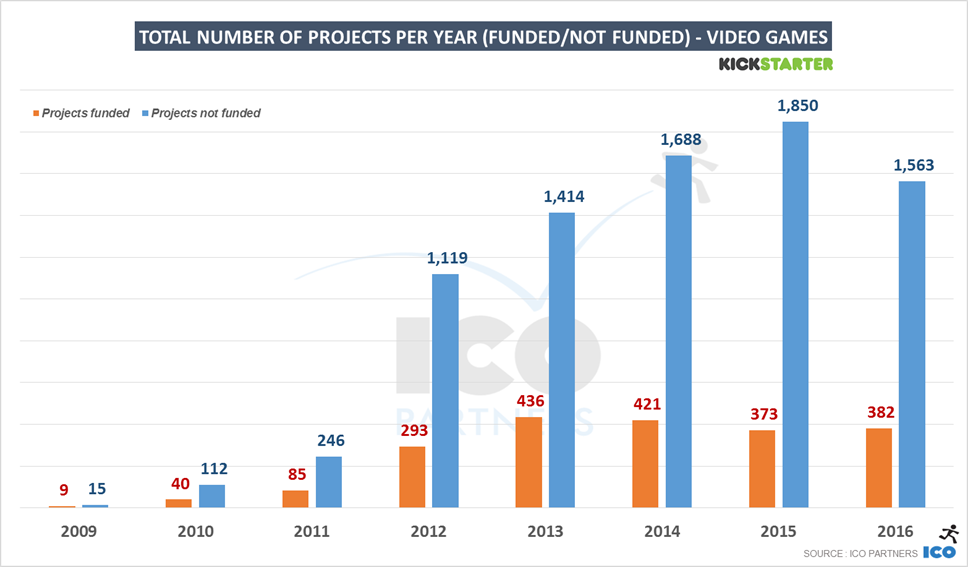
When accounting for the total number of projects funded though, the year-on-year change is a lot less drastic (-13%). That’s the platform 3rd best year in that regard. Before diving into the breakdown of projects per tier, it is obvious that the significant drop in the total amount of money raised is significant partly due to the absence of large projects.

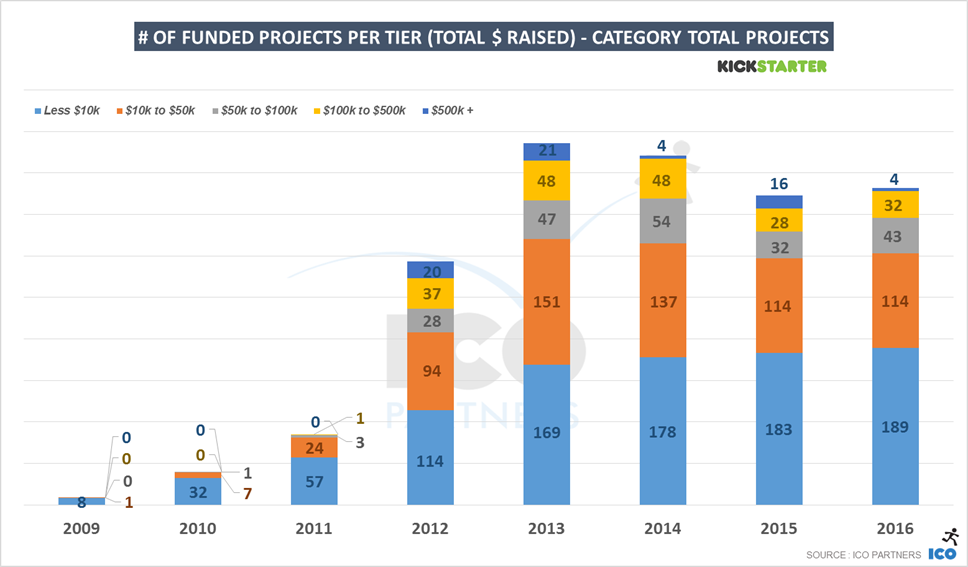
Looking at the amount of money raised per tier first, the highest tier of funding was almost a 1/10th of what it was in 2015. If you ignore that tier, there actually was more money raised on Kickstarter than the previous year. Kickstarter in 2016 missed out significantly from this lack of high level projects. Of course, Fig.co hosting Psychonauts 2 and Wasteland 3 didn’t help. But even if these two projects had been funded on Kickstarter, 2016 would have been a low performing year (whether you account for the project equity of the Fig.co or not).

It seems that there’s only ever a limited volume of such large projects considering crowdfunding, meaning there will be a visible effect on the overall performance for the video games category in crowdfunding in any given year based on the volume of these high performance projects – there will naturally be years where lower numbers of these big projects come to the platform due to factors such as the long development cycles. This will likely continue, unless crowdfunding suddenly becomes more popular with studios (in the way it’s popular for Tabletop Games as we will see next), but this seems very unlikely given the current trends and the nature of what it takes to create big video game projects.

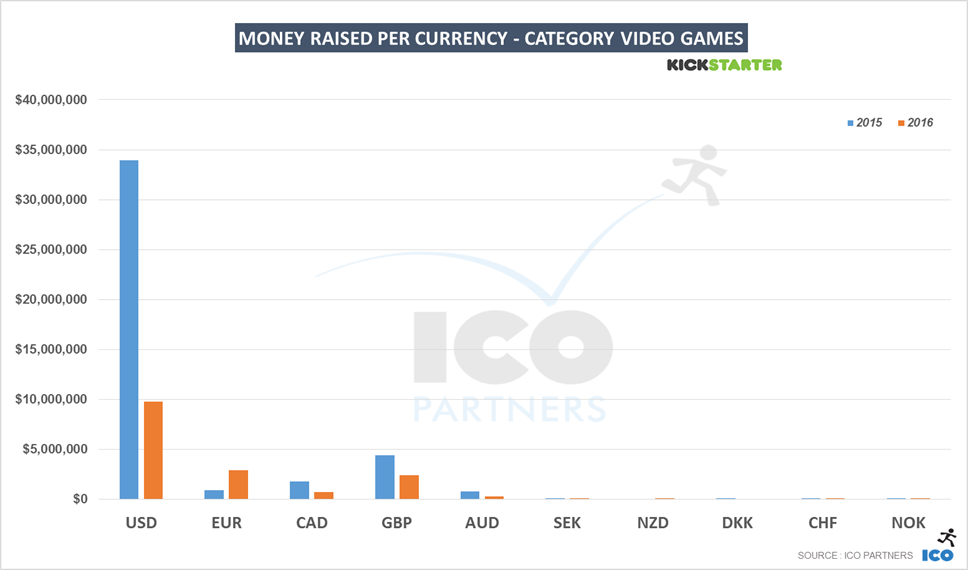
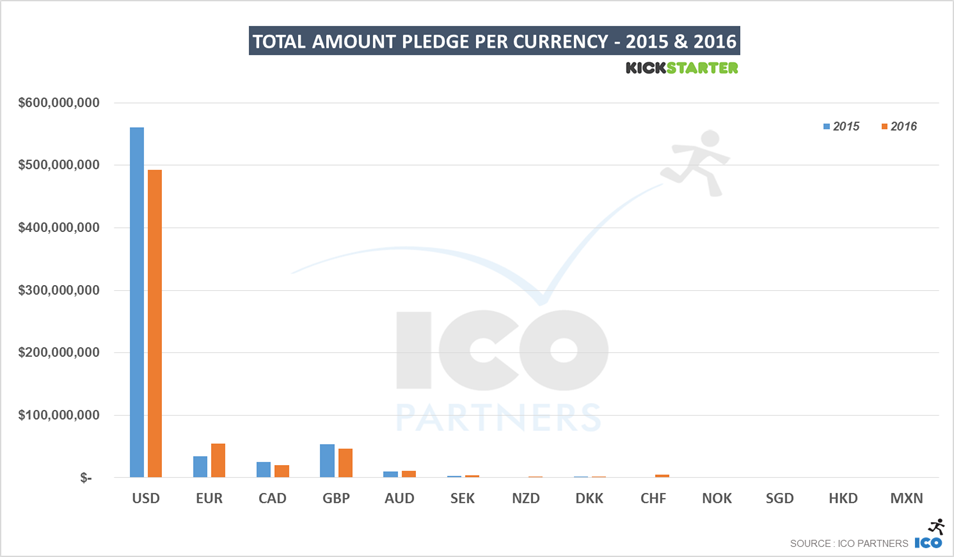
The share the projects in USD represents has drastically dropped this year. The common idea that you have to launch your project in that currency to succeed for video games should be dismissed by looking at this year’s numbers. With the projects in EUR seeing a considerable increase, they represented 18% of the money raised for video games last year, with GBP projects representing 15% of the total. USD projects, that raised 81% of the total amount of money raised in 2015 for video games, represented only 60% of the total amount raised last year.

Looking at the number of projects every week on Kickstarter, the trend is not of a collapse in the number of funded projects. There were fewer projects launched on the platform, and across all categories, but for the past 2 years it seems that the volume of projects being funded is actually quite stable.

Another unseen competitor is Steam Early Access. The minimum required quality to launch a crowdfunding campaign for a video game is such (beautiful assets, good video, demonstrable gameplay) that it wouldn’t be surprising if many projects considering crowdfunding simply decided to skip it, and go in Early Access instead, with the idea to be able to start getting revenue regularly directly on the main platform the game is sold on to the end users.

Tabletop Games


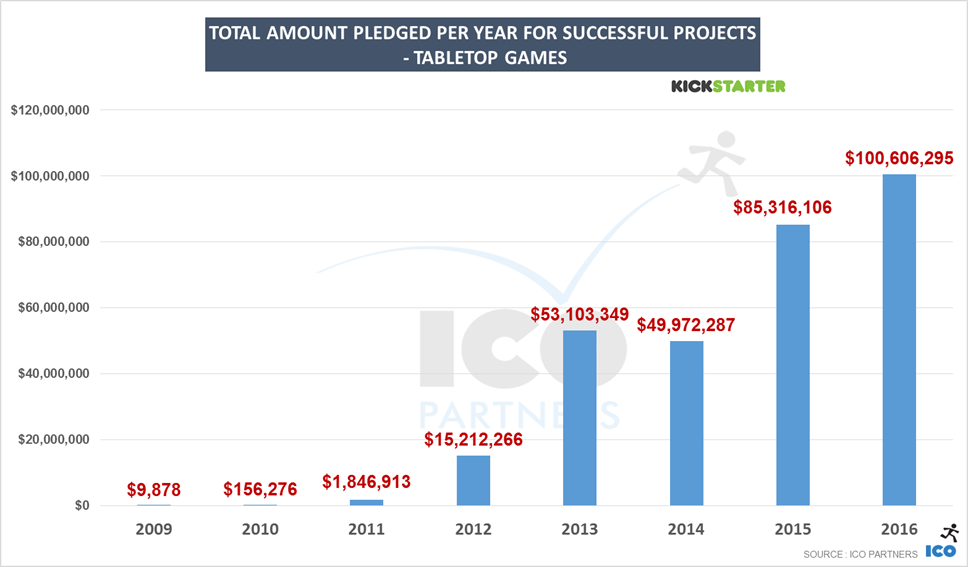
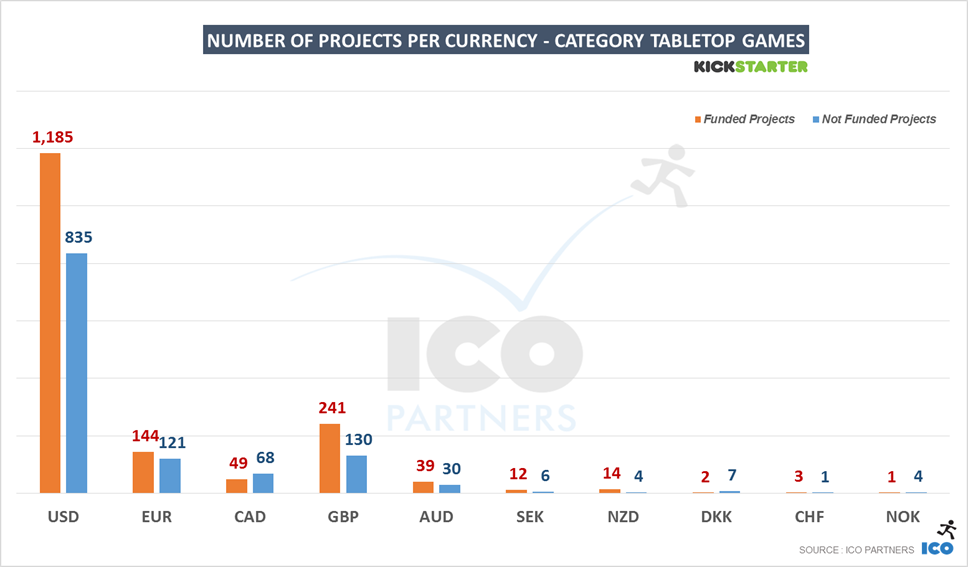
Over the years, Tabletop games have become the crown jewel of the Games category on Kickstarter. More projects got funded (+21%) for a larger total amount of money (+18%) than in the previous year, with more than $100m pledged to successful projects.

Recently, in a Polygon article about the upcoming PAX unplugged, the ICV2 estimate of $1.2bn for the size of the tabletop North American market was mentioned. If we estimate the market has grown a bit since that estimate, say $1.4bn, and if North America represents 45% of that market (making up numbers here, just for the thought exercise), that’s a $3.1bn global market. With $100m a year on Kickstarter, that’s 3% of the whole market transaction happening solely through Kickstarter. My estimates are of course very shaky, but they’re not totally unrealistic. That percentage is likely to be even higher when considering purely the North American market, which has historically been more culturally friendly to crowdfunding.

In the tabletop games industry, Kickstarter is not only the primary platform for crowdfunding, but is also now a key actor to the whole ecosystem.

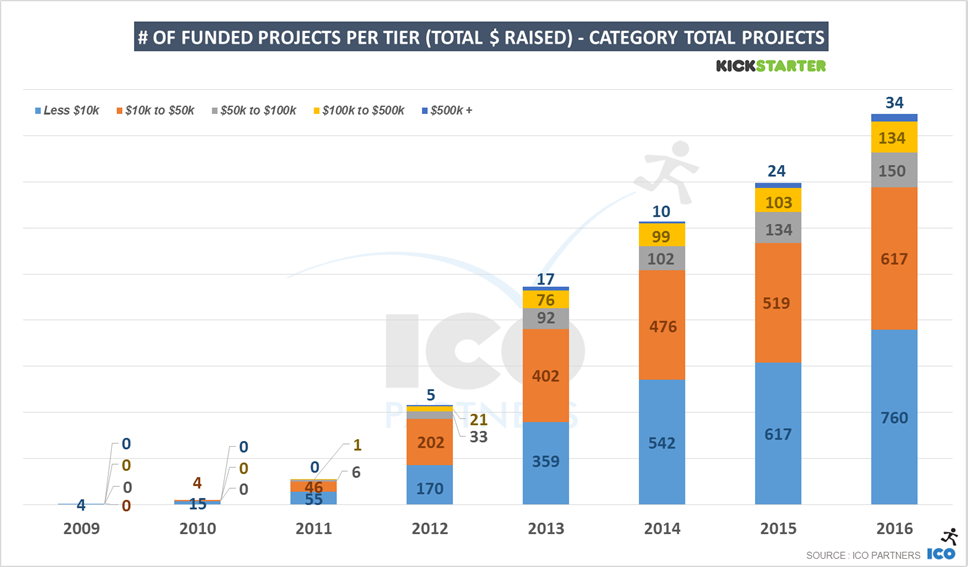
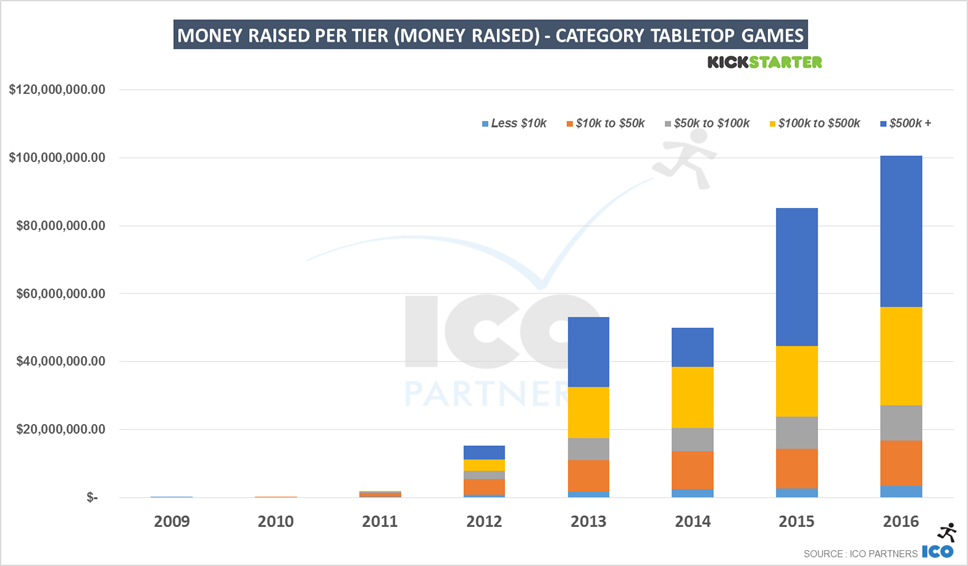
There was more money and more funded projects across all the different tiers in 2016. Interestingly, compared to video games, the lowest tier (under $10,000)  grew 32% in the total amount of money raised.

The most significant change is for the $100,000 to $500,000 tier again. More funded projects (+30% with +31 projects) and more money raised (+39%), the average per project in that tier increased to $216,000. Again, this can be seen as a result of a more professional approach to the way the campaigns are managed.

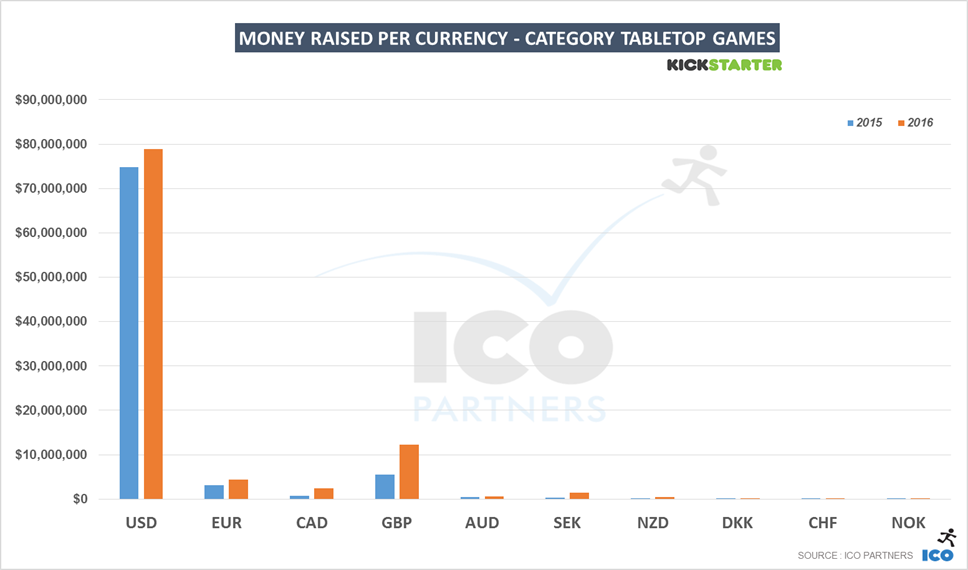
The biggest relative increase this year was for the GBP projects, more than doubling the amount raised year-on-year, and this despite the currency taking a nosedive in the second half of the year due to the Brexit referendum results.

The USD projects are still largely dominating though, representing almost 80% of the total amount of money raised.

There seems to be a lot of growth potential for European tabletop projects on Kickstarter, especially considering the cultural importance of the region for the tabletop games business. The lower numbers at present might also be due to local crowdfunding platforms performing particularly well. For instance, Blackbook Edition, that runs its own crowdfunding platform for tabletop roleplaying games in French, has raised $1m in 2016 alone.

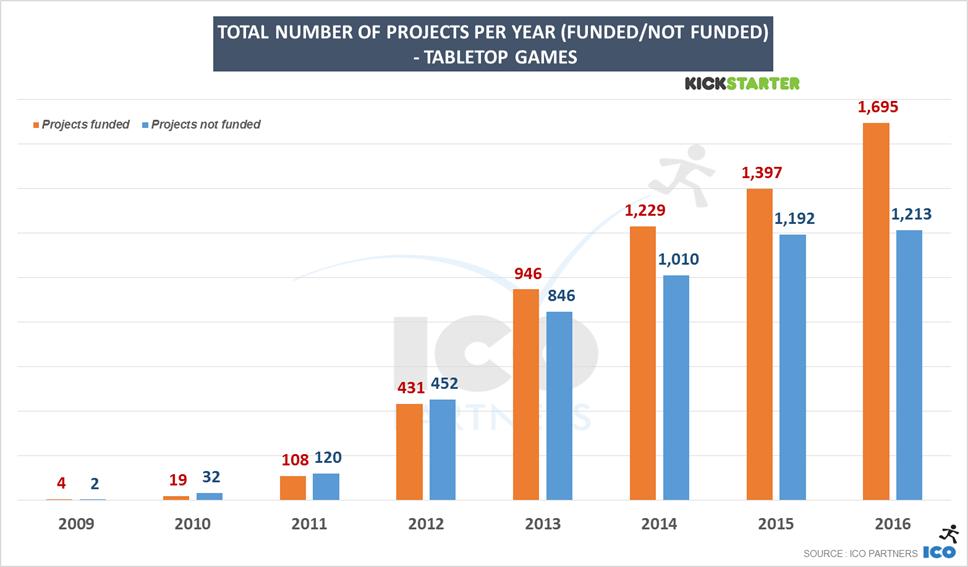
Compared to the relatively even and stable video games chart, it is very clear that the Tabletop Games category has steady growth in the number of projects that get funded each week.


Finally, at the beginning of the year, and thus not showing in any of the data present, the largest Games campaign ever funded on Kickstarter ended, raising a staggering $12.3m. Alone, it raised about 12% of what all Tabletop games raised in 2016. That was on January 7th. I feel very confident that 2017 will again be a record year for Tabletop Games on Kickstarter.


In preparation for my upcoming GDC talk “Get Journalists to Cover Your Game: Lessons from Online Dating, Praying and ‘No Man’s Sky‘“ I talked to plenty of high profile journalists to find out what makes them cover games.

One thing that kept coming up was that animated gifs – in pitch emails or spotted on twitter – often easily convince editors to check out a game.

Also from professional experience of doing games PR for years I can’t think of a better tool to show off your game. Our current approach at ICO Partners when pitching games in emails to media and influencers is to have a snappy headline, two short sentences that explain why they should care about a certain game followed by a nice animated gif and links to the press page and a blog post / full press release. That’s about it. Sounds easy but actually boiling the essence of your game down in two sentences and a 5 second gif is quite a lot of work (but it’s work that pays off).

For this reason, I decided to put together a guide for creating easy and pretty gaming gifs, that should give you all the tools you need to let your game shine in a nice animated image.

Source trailer


I separated this article into 3 steps

1) Decide what you want to show in the gif

2) Get video material for the gif (we discuss three options here)

3) Compress the gif  


Disclaimer

  • Please note that there are probably more ways to make gifs then there are Final Fantasy games (even including spin offs). The following methods are my favourite ways to make animated gifs from the different ways I’ve tried, but if you have alternative suggestions please let me know in the comments or on Twitter.
  • Working in an PR agency we usually don’t capture gameplay footage for the gifs ourselves. This is why this blog post focuses mostly on how you make gifs if you already have video material in the form of a trailer or a video and want to transform it into a short animated gif. This proved to be a good method to get, with some practice, nice gifs out there within a couple of minutes of work.
  • We are still not sure how to pronounce gif correctly.

Source trailer

1) Decide what you want to show in the gif

First, think about what the highlight of your game is, or what you want to show. Maybe it’s a special gameplay feature, maybe you want to explain the concept of your game, maybe the atmosphere, or maybe you just want to show off some nice animations. Depending on that the size, resolution and length will vary greatly, and because gifs are so small in file size you really have to focus your attention on your most outstanding feature.

I usually try to think of gifs like little film trailers – you probably won’t have the time to explain all the details your game but your aim is to bring the mood and main selling point across in a way that should make people care and want to find out more.

Source trailer

2) Get video material for the gif

Depending on what you want to show in your gif there are different paths you can take on the recording front. I always decide first I want to a) show short looping gameplay snipped in the gif or b) have a gif that is sort of a mini trailer for the game (perfect for the game announcement or launch).

At this point don’t worry too much about file sizes or resolutions, we will compress the gif in the next step. Do however keep your gif length in mind. I usually make them 3 to 10 seconds long for Twitter and email usage. Although this sounds pretty short you can actually fit some good material in there.

Source trailer

Option a) Record your gif footage in-game
As mentioned in the intro, working in a PR agency we usually don’t capture footage ourselves but get videos on trailers and transform them into gifs which proves to be a time-saving way with good results (more on that in Option C.). If you instead want to capture footage yourself that is a good option too. In this case I would recommend listening to people that know more about video capturing than me in one of the many online threads and tutorials about capturing footage and moving on to point 3 about gif compression. (Also if you have tips and tools on capturing please let me know Twitter).

Option b) Record a short gameplay snippet from a video
If I already have a video that I wish to record some gameplay footage from for a gif, I use free software called gifcam (download link). It opens a little frame on your PC screen and captures whatever appears within that frame.

Once the software is open, simply have your game or a video of your game (often easier) running and capture the bit you want.

Usually my window capturing size is about as big as as a credit card (don’t make it much bigger, you will need to compress the gif anyway) and be sure you record with the maximum frame rate that GifCam allows. In terms of frames per second it’s always better to get a nice raw file and compress it later.

Source trailer

Usually it takes a few tries to get exactly the bit you wanted but the software also offers a simple editing engine to remove the things you recorded by accident, or if you want to get a gif that loops in a perfect cycle.

That’s it! Skip the next part and go to the section about gif compression


Option c) Transform a trailer into a gif trailer
This is my favourite way to makes gifs, as it’s usually really quick to do and brings great results! All you need beforehand is a trailer or a video of your game. First some tips on how to cut your video into gif length and then some tips how to transform the short video into an actual animated gif.

Source trailer


Option C step one: Cut your video into a small video in gif length

Load your trailer or gameplay video into a video editing programme. The options here are limitless, from pro software like Adobe After Effects, to free software like Movie Maker or iMovie – anything that can cut video works. I usually use Videopad Pro. It’s very straightforward and costs around $30. Next you cut together the nice little video that will end up es your gif but for now save it any common video format (mov. Mp4 and so on).

Some general tips when cutting small video in gif length:

  • If you want to show variety you can show 2-3 different scenes and usually I aim to show each at least 1,5 seconds. Otherwise the gif feels messy.
  • Often it makes sense to show different aspects of your game (gameplay vs cutscenes, different levels, different characters) to paint a broader picture of what your game is about.
  • I usually try to pick something eye catching straight from the start, so the viewer sticks with the gif to the end.
  • I would advise showing an end slate for a couple of seconds at the end of your gif. This is just a screen that usually shows your game title and maybe the platforms and / or release date (look at the Northgard gif above – I mean the last part with the Steam and game logos). This is vital information if your gif gets shared around online (otherwise how are people gonna find you?), and as this is a static image it’s relatively small in file size so won’t add much weight to the overall gif.
  • I usually fade out the ending of the video to a black screen (the last 0.3 seconds or so) to let it loop smoothly. As in the Northgard gif above it’s quite hard to spot if you don’t know about it but it makes the cut to the beginning of the gif smoother.
  • Again, focus on the essentials I would recommend not go beyond 3 to 10 seconds in length if you want to use your gif on Twitter.
  • If your game plays much better than it looks it can help to include a good press quote in the gif if you already have one. Just don’t forget to check back with the editor first to ensure it’s okay to use the quote.

Cool, now that you have the raw video version of your gif footage, we want to transform it into a gif.

Source trailer

Option C step two: Transform your short video into an actual gif file

  • Go to ezgif.com. After uploading your gif in the “video to gif options” there are a couple of important variables you can change next.
  • Set the right length. Be sure to set the right start and end time for your gif. By default this option is always set from 0 to 5 seconds.
  • Set the right dimension. Here you can already pick the dimensions of the gif. Usually I resize it later anyway but it doesn’t hurt to pick something that is close to your final output – for gifs for Twitter and emails I often use 480xAuto here.
  • Set a right framerate. In most cases I aim for the 10 or 20 frame option but it really depends on the game. For a more static point and click adventure for example 10 frames will be fine, but for a game where you want to show off gorgeous animations I would rather go for the maximum of 25 frames per second so it looks super fluent, but save file size by reducing the image size and gif length. The best approach here is to just switch between the different options and see how many frames you need to make it look nice.

3) Compress the gif

Once you have your gif, the final big step is to compress it to fit your needs. Again, there are probably many ways to do this but my favourite quick and easy go-to solution is also on the website ezgif.com.

First, think about where you want to use it before you go to compress your gif.

  • My most common use of gifs for PR purposes is for posting on Twitter, and also for putting straight into emails for media. For these approaches you should aim for a gif under 5MB. That’s the maximum size that Twitter will display animated gifs on mobile (15MB on desktop), and it’s not so big in emails that it will take ages to load – time in which you could lose your audience already.
  • If you use your gif for a website or other platforms, you might want to have a bigger file size

Source trailer


Use the gif optimizer on ezgif.com

  • Upload you gif to ezgif.com in the  “gif optimizer”.
  • I ALWAYS use the default “Lossy Gif Level 30” option as in my opinion it cuts down the size file nicely while sacrificing very little of the image quality.
  • If your gif looks nice at this point and is under 5MB (or a bigger file size you prefer if don’t need it for Twitter including mobile or emails) you are DONE!

  • If the gif file size is not right just yet don’t worry. It usually takes me a few tries of hitting the sweet spot between quality and the right file size. What you can do now to bring the file size down is:
    • Make your gif shorter
    • Make the gif image size smaller (this saves quite a lot of file size, but I wouldn’t go under 350x for Twitter and emails)
    • Use the medium and high levels of the “Lossy gif optimisation” option on ezgif.com. Depending on the game (for games with fewer little details and diverse colours for example) this can save you a lot of file size for little quality degradation. I always give this a try to see what it looks like.
    • Use a lower framerate. Either by going back to the “video to gif” option on ezgif.com and saving your video with fewer frames, or by using the “give optimizer” and the “drop frames” option.

After all those steps and some playing around you should have a great looking gif!

Tl;dr gaming gif guidelines

  1. Decide what you want to show in your gif, focus on the essentials
  2. To use the gif for twitter (including mobile) and emails stay under 5MB
  3. A good length is often 3 to 10 seconds
  4. A good size is around 400 to 450 pixels in width (no smaller than 350 pixels minimum)
  5. To capture gameplay snippets from a video for your gif, gifcam is a good option
  6. To make a mini gif trailer out of an existing video simply cut it down in any video editor and use ezgif.com to transform it into a gif
  7. Compress your gifs with ezgif.com


As has become the tradition, I have made a deep dive into the Kickstarter data we collect so I can present to you a review of the past year for the crowdfunding platform.

For the readers used to my focus on games, this is my one article a year where I actually widen the scope of the research, I will follow it up with an article specifically on games next week (and if you can’t wait, you can go read my article on GI.biz I wrote on the topic of crowdfunding in 2016). If you have a curious mind, you can check last year’s post, but I will do a lot of year-on-year comparisons here.

First year of decline for Kickstarter


After many years of constant growth, for the first time Kickstarter saw a decline last year.

It would be very hard for me, with the limited data set available, to fully explain why. As I am only looking at Kickstarter, I can’t tell if the decline is due to the enthusiasm of the early days of the platform wearing off, the competition eating into Kickstarter market shares, or crowdfunding building an image for unreliability and losing its wider appeal. I can however share my other findings, time will tell if this decline is a trend that will continue or if it will stabilise (a bit more on that later though as we have some indicators).

The first interesting point on the decline observed is the fact that the drop in the number of funded projects (- 14.5%) is much more significant than the drop in the total amount of money raised in the platform (-7%). That means there is a higher concentration of funding per project than in 2015 – if on average projects have raised more, but the platform saw an overall decline, it would seem to indicate that we might be heading towards either a more demanding audience (the quality of the campaigns need to reach a higher quality bar to meet its goal), or more professionally built campaigns are launched on the platform (raising more money and being more reliably successful), or more likely, a combination of both.


What is also noteworthy is that the drop in the number of projects is bigger (-31%) than the drop number of funded projects. This is certainly coming from a more general realisation that a Kickstarter campaign is not an easy money grab. We can see the percentage of projects getting $0 (my metric for “junk projects”) has dropped in the last year, from 20% of all the projects on Kickstarter in 2015 to 14% of all projects in 2016. This feeds nicely the idea that projects on Kickstarter are getting more professional or more serious overall.


If you are not familiar with the format I usually use, the following graphs are showing the break down of projects based on the amount they have raised (in USD).


In terms of the number of funded projects, the biggest decline observed is for the lowest bracket, projects that raised less than $10,000. This group saw a -19% decline both in total number of funded projects and total amount of money raised by these projects. This is obviously not caused by more smaller projects managing to break through the higher bracket, but by the decline in the number funded projects for all the next brackets. Where we see an increase is in the number of funded projects in the brackets of “$100,000 to $500,000 raised” and “More than $500,000 raised”, despite the overall decline seen on the platform. There were more projects raising more than $100,000 in 2016 (978 projects) than any year prior. This is for me another sign of Kickstarter campaigns becoming more and more sophisticated and professional, and managing to raise more money than the prior years as a result.


If you have a particular interest in a specific category, you can find slides with detailed data for each one of them at the end of the article.

Looking how each category performed on the platform is always very interesting and says a lot to what happened on the platform. All the different categories exist in their ecosystem and microcosm, and the performance of one category could very easily contradict platform-wide trend.

In 2016, there are only 3 categories that saw a growth in the total amount of money raised: Crafts, Fashion and Publishing. Crafts is a very small category overall and as such, its performance is easily subject to variation. Publishing only saw a very small growth year-on-year (+2%), but this was only true for the total amount raised, as the number of funded projects declined (-4%). The only category that saw a proper growth in 2016 was the Design category, which grew +8% in total amount raised and +5% in the number of funded projects.

All the other categories raised less money in 2016 than in the previous year, but the decline is sharper for some. Both the Film & Video category and the Music category are leading the decline in terms of money raised. Interestingly, these two categories used to be the leading ones on Kickstarter (prior to 2014), and their continuous decline is probably the most worrying. It might be that they are creating a pattern that the other categories currently leading on Kickstarter will follow in the coming years, or they might be of a nature that makes it particularly easy for Kickstarter competitors to snatch market shares from them, or they might have an ecosystem that realised that crowdfunding wasn’t as needed as for other projects (specifically, I am personally thinking that both Films and Music have existing and very solid funding systems, while this is not necessarily true for other creative environments). As stated earlier, the data set I am looking at doesn’t provide a proper answer to this question.

Looking at the currencies in which the projects are run, it is quite obvious that Kickstarter is still very much an American platform, even the EUR has now become the second currency in terms of total amount of money raised. EUR projects are still behind the GBP for the total number of funded projects though, highlighting the fact that EUR projects that decide to go on Kickstarter are probably ones that are ambitious and with a look to an international audience. I suspect many smaller projects (and more local projects) choose to go on other platforms that have been present locally for longer. This is still a win for Kickstarter in many ways as it managed to grow in a region where it has established competitors.

This is a stacked area graph showing the number of projects per week on Kickstarter, funded and not funded.

End of July/beginning of August 2014, something happened that boosted the number of projects launched on Kickstarter, but with little to no impact on the number funded projects on the platform. I have only very little evidence of this, but I think this was all due to the Potato Salad campaign. It was heavily talked about in the media and it painted Kickstarter as a platform where money was easy to raise. Certainly if a guy can get $55,000 for a potato salad, my own awesome project should be very easy to fund. The reality is of course much more harsh, but Kickstarter could see the effect on its number of project for 18 months. This flood of projects might have also had a negative impact on Kickstarter’s image, and the fact that there are fewer overall projects submitted might not be such a bad thing for them.

Finally, to conclude my analysis of the past year on Kickstarter, I wanted to share a more granular graph of the evolution of the performance of the platform over time. Looking at the amount of raised every month, last year decline doesn’t appear as a phenomenon that goes on worsening. February 2016 was the one month with a particular decline compared to the previous year and bears most of the year-on-year decline. So while there is also no hidden growth, this is the one set of data that makes me feel relatively optimistic that we are not seeing a bubble bursting, and I have very much in mind a very interesting talk from David Edery at GDC in 2010 on video games platforms, and the pattern he observed where some of them go through an “inevitable misery” decline before a “triumphant return”.


A look at the categories

Kickstarter asks creators to put their projects in different categories. This allows us to look at the different trends of each of those categories. While you can find a lot more details in the documents on Slideshare, I have summarized some key takeaways for each of them below.

Art

There was a significant decline in the total number of projects funded. Interestingly though, most of the drop in the money raised was on GBP and EUR project, there was a slight growth of the money raised in USD by contrast.

Crafts

A relatively small category, it was still growing this year. The number of projects that raised more than $50,000 went from 3 to 9.

Comics

The money raised in that category saw a small drop (-5%) year-on-year, but 2016 is still the second best year ever for that category. It is interesting to note there were no $500,000+ project this year and the total number of funded projects grew +9%.

Dance

While the amount of money raised has been comparable to 2015 (+3%), the number of funded projects dropped by -12%. But more interestingly, the number of projects launched dropped by a whooping -30%. [loss of KS zeitgeist?].

Design

After a stellar growth in 2015, the Design category is one of the few that kept growing in 2016. The growth happened mostly with non-USD project (the total amount raised for USD projects declined a bit in 2016), especially with the EUR projects, following the trend observed last year. Like for most categories, the total number of projects launched on the platform declined, even though more projects got funded in the end.

Fashion

The Fashion category is very stable year-on-year. Almost the same amount of money was raised, even if a fewer number of projects got funded (-11%). This was the first year where 4 Fashion projects raised more than $500,000, helping maintaining the total amount raised.

Film & Video

2016 wasn’t great for this category. In terms of total of money raised, it dropped below the level of 2012 (-38% from 2015’s amount). The number of funded projects also saw a significant drop from last year (-25%). The decline is seen at all Tiers of funding. Small or big, there were fewer Films funded on Kickstarter in 2016. The one subcategory that saw a significant increase is the Animation subcategory, where $3.6m were raised in 2016 compared to $1.8m in 2015.

Food

The Food category dropped below the $20m per year mark in 2016, with a sharp decline of the number of funded projects (-32%). Projects in EUR were some of the few that saw growth from the previous year, raising more money in total than the British and the Canadian projects.

Games

Like last year, I will do a deeper dive into this category next week. For now, I will note that following the trend, less money was raised in this category than during the previous year. However, the total number of projects funded actually grew, and the decline in the total amount raised was mostly true for projects run in USD. Projects in EUR and GBP raised more money in 2016 than in 2015. The percentage of the projects seeking funding and getting in also grew to 37%, the best success ratio in that category since 2010.

Music

This category follows the same pattern as the Film & Video category: a significant decline for the 3rd year in a row. Both the total amount of money raised, 2016 was the worst performing year since 2011, but the total number of projects funded, it was the worst year since 2010. For the music genre, Country & Folk subcategory is #1 for money raised as well as for number of funded projects in 2016.

Photography

The category has been stable in terms of total amount of money raised, mostly thanks to 2 projects raising more than $500,000, as the total number of funded projects here again saw a decline (-15%).

Journalism

This is still a small category, and while it also saw a decline in both the total amount raised and the total number of funded projects, this was also the very first time Kickstarter had projects raised more than $100,000 in that category. And it wasn’t just one project, but four of them, highlighting one of this year’s trends that a significant part of the decline on Kickstarter is affecting the smaller projects on the platform.

Publishing

Like last year, there was a slight drop in this category’s total number of funded projects, however, the total amount of money raised did see an increase (+4%). All that growth came through projects in EUR and… in AUS (Australian Dollars)! Like for many categories, the drop in the number of projects launched on the platform has declined way more (-28%) than the decline in the number of funded projects (-4%).

Technology

After a stellar year in 2015, the Technology category saw a small decline in the total amount of money raised (-1.5%), and a more significant decline in the number of funded projects (-18%). Again, this comes with an even bigger decline in the total number of projects submitted on the platform (-28%). The one axis of year-on-year growth was for projects in EUR, which was the second currency on the platform, raising more money than projects in GBP for the first time. Also interesting to note was the growth of the Wearable subcategory (+11% money raised).

Theatre

A fairly small category that last year dropped to its lowest amount of money raised since 2011. In 2016 the decline continued, with this time even fewer projects getting funded than in 2011.  And once again, the one area of growth was with projects in EUR, that raised more money than in 2015.

All the slides

A note on the methodology

Like for all previous blog posts on the topic, we have been using the data on the Kickstarter pages themselves (with the help of Potion of Wit) and the collection method is not without its own issues. Please consider all of the numbers presented here as estimates.

Back in October, I did an analysis of the announcement of the Nintendo Switch. It was a rather short one, with very few details shared at the time, with the promise of a more in depth presentation following an event in January. That event was last week, and now is a great time to look at how it went for the Nintendo teams.

The Console

There is no question that, of the three console manufacturers, currently Nintendo is lagging behind Sony and Microsoft and that is very apparent when looking at the media coverage of each console.

In the video games media landscape report that we shared last year, Nintendo received less than a third of the articles that PlayStation had. In that respect, the Switch announcement seems to have been fairly well covered. We are lacking data to compare it with other console announcements, though.

Here is another graph to illustrate how significant the event was for Nintendo’s coverage:

While it is not surprising that the main event showcasing a new console is the single biggest media event for Nintendo in the past 3 years, the scale it reached is significant. It is the single biggest announcement in terms of volume of coverage across all 3 main consoles for that period of time. For Nintendo, a company that is struggling to compete with the media attention its two contenders receive, it looks like a massive achievement.

And with the new cycle of consoles being upgrades from the current gen, rather than brand new iterations, this might stay true for a while for all we know.


Games

* Minecraft numbers are only for articles explicitly naming the Switch and Minecraft.

Looking at the games announced at last week’s event, there seems to be 4 categories:

  • Zelda is alone in the lead, with twice as many articles as any other games. Nothing surprising here: it was the crown jewel of the line-up, the game that was playable on-site, and it’s the one key launch title for the console. It is interesting to note though that it is garnering even more coverage than at last E3, where it was one of the leading game in terms of coverage (2,300 articles over a week compared to 2,600 articles since Friday)
  • Nintendo’s first party titles – they benefited from the full support of the firm’s communication effort. It’s also interesting to note that existing licences are performing better than the new brands. This is very normal of course, but interesting to actually see it in numbers.
  • 3rd party titles from key Japanese licences – I put in this bucket Bomberman, Fire Emblem and Xenoblade, that all received 400+ articles from the event.
  • Other 3rd party titles – this is of course more varied and spread out, but I think it’s worth noting Snipperclips and Octopath both securing more than 200 articles – no small feat for projects with their profiles.

That’s it for me (for now).

At ICO Partners we do PR for a wide range of games (from SMITE to Armello) and recently we started working on our first episodic game: The indie title The Lion’s Song.

To celebrate this week’s launch of Episode 2, we want to share some episodic-specific PR lessons we learned from supporting developer Mipumi Games in launching Episode 1 of the game.

the-lions-song-youtube-previewThe announcement trailer of The Lion’s Song.

1) Announce the whole “series” before talking about single episodes

We decided to announce the whole “series” first with a general trailer, describing the game concept and teasing what the individual episodes would entail. The challenge when promoting a game, and particularly when trying to make a strong first impression, is always to find as many strong talking points and PR angles as you can.

Focusing on just one episode for that first announcement would have severely limited the amount of talking points we had to work with, and wouldn’t have allowed us to sell the overarching vision for what the team are trying to achieve with the season as a whole. This additional outlook on the other episodes could also give further incentive for players to buy a Season Pass.

the-lions-song-1-media-coverage

A downside of announcing the season first is that it means you need to nail down details and commit early. Additionally, having a trailer showing footage of all episodes at such an early stage proved to be a challenge because…well, the studio only had footage of Episode 1 at this point. To make this work Mipumi Games had to create individual sections for the later episodes from scratch just for the video, which of course could have a knock-on effect on the development plan and schedule.

the-lions-song-banner

Looking at the coverage breakdown though (graph above), we would highly recommend this approach for promoting smaller episodic games. For us having a general reveal trailer of The Lion’s Song resulted in 74 online articles and got even more articles than the launch of Episode 1, with announcement coverage from high profile sites such as Killscreen, Pocketgamer, France’s (and looking at Alexa also Europe’s) biggest gaming site Jeuxvideo.com and the major German gaming site PCGames.de

2) Be careful with your wording if your first episode is free

Mipumi Games decided to launch Episode 1 – Silence for free: they saw this as an opportunity to expose the game to the largest number of players possible from the beginning, and that would hopefully convince players to stick around for the upcoming episodes.

the_lions_song_screenshot_02

From a PR point of view however, we were concerned that having a free first episode could result in media thinking The Lion’s Song was a small, almost fan made-like game, which could result in them deciding against covering it. After all, it’s a pixel art title from a relatively unknown studio, and all of our messages and promotional assets would say it’s free.

To avoid this from happening we put a lot of work into finding the best phrasing in the communication around the free episode correctly. Whenever we said Episode 1 is free for instance, we would immediately mention that the whole Season Pass costs €9,99. By doing this, we let people know that this is a premium quality game, but a game that we wanted to bring people into and try for themselves by removing that initial barrier to entry.

3) Press seems to focus and your first episode

At ICO, we have developed a tool we call the Media Monitor that basically tracks thousands of websites and shows us how individual games perform in the press (for more info on how it works look here). For The Lion’s Song, we took advantage of the tool and looked into data from other episodic games like Life is Strange, Hitman, King’s Quest or Tales from the Borderlands to see how their coverage evolved over time.

Looking at the coverage per episode it became clear episode 1 gets most media traction, whereas all episodes after that seem to drop in term of media coverage. You can see King’s Quest, Minecraft: Story Mode and Tales from the Borderlands as an example below.

the-lions-song-2-launch-coverage

Based on the data we would recommend to put most of your PR efforts and resources, especially for assets, into the initial announcement instead of saving your PR fireworks for later to build up hype. Of course it makes sense to try to keep pushing to gather press attention, but the first  episode will be the easiest points of your campaign to get eyes on your game, so take advantage of this.

4) Try to boost the news value of your other episodes

the-lions-song-3-life-is-strnage

Life is Strange proved to be an interesting case study in another regard: we looked at how much coverage each episode got when it’s launch day was announced. As you can see, episode 4 clearly breaks the pattern mentioned above. What happened? They announced a newsworthy sales milestone of 1 million copies sold at the same time as announcing episode 4 to boost their announcement – a clever way of helping the “weaker episodes” gather more traction.

That’s something we are looking into for the upcoming episodes of the Lion’s Song.

5) Youtubers are your friends, especially for episodic games

If you have followed the discussion around That, Dragon Cancer, the developers were not too happy about people streaming and putting together walkthroughs of their narrative game as they felt it hurt sales. Even though The Lion’s Song is a narrative game as well, the whole dynamic changes with episodic games, especially when episode 1 is free.

the-lions-song-youtube-preview-2Youtuber NichBoys playing The Lion’s Song

So while Youtubers might have “spoilered” Episode 1 for some players, we think the benefit of having more exposure and potentially hooking viewers on the upcoming episodes or the Season Pass seemed like a bigger positive for us. In the end, you can never really prevent videos from being released, so why not encourage and assist YouTubers/streamers who are interested in your game and have a direct line into the audience you are trying to reach

6. Consider not announcing the release date of your episodes

Working on many titles in a more traditional release cycle, we are used to announcing release dates before launching a game to get players and press in the right mindset, letting them know the game is coming soon and hopefully getting them excited. Looking at other episodic games, their tactics vary widely: From announcing the release date a week before (Life is Strange) to simply announcing the moment the episode becomes available, like most mobile games.

tls_launchdate

Going through our Media Monitor, we couldn’t make out a clear pattern that generally seems to work best, but we still learned a valuable lesson: a release date announcement for smaller games generally splits your media impact between two news beats (release date and launch shortly after) and can therefore drastically weaken your media impact on launch day – a moment where you usually want most players to hear about your game because they can get their hands on it straight away.

the-lions-song-4-life-is-strange-launch-announcements

For high profile titles like Life is Strange (graph below) this might not matter too much, as media and a large, enthusiastic player base are generally aware of and excited for an episode’s upcoming launch anyway.

For a smaller game gaining traction for two news beats close to each other seems more difficult. As an example we looked at Dreamfall Chapters (which is a bigger project but didn’t reach the scale of The Life is Strange’s media impact) and their media coverage with announcing the release date beforehand.

the-lions-song-5-dreamfall

For our smaller episodic game, splitting the news value per episode into two seemed like it would overall damage the media impact we can have, particularly for launching the traditionally weaker performing episodes. That’s why we decided that after Episode 1, we will only announce the Lion’s Song episodes once they are available to have the best chance of cutting through the media noise that day.  

That’s it for now. Thanks a lot to developer Mipumi Games for letting us share these insights and data points. We hope you found it helpful. If you have questions, or other tips you can reach me under @Olima on Twitter and in the comments.

This month has not only been busy with new game releases, as expected for this time of the year, but also with new announcements. On the back of the analysis of the PlayStation VR release and its media coverage, I went and looked at the media coverage that the recent Nintendo Switch reveal has secured.

A tweet and a video

There are not many console announcements; their life cycle is long enough to make them a rare occurrence. Our media monitoring tool has been running since mid-2013, but getting really in shape from early 2014 onwards, so I don’t have much data to properly compare the Nintendo Switch announcement. I will mostly use this year’s PS4 Pro and Xbox Scorpio announcements, keeping in mind that these are not full-blown new hardware being released, but upgrades of existing consoles.

The way the Nintendo Switch was announced is also unusual. It was outside of any major media event and in the middle of the busiest month for video games media with the release of many AAA titles; a new format for this kind of announcement. Also, Nintendo has been very sparse when it comes to details about the console (no detailed specs, no price point, no confirmed release titles), and stated clearly that they wouldn’t provide any of this until nearly next year.

With all this in mind, how well was the announcement covered by media?

articles_compared

Purely looking at the number of articles, the Nintendo Switch secured fewer than the PlayStation 4 Pro did at its reveal back in September, but way more than the Xbox “Scorpio” did at E3. I would call this a small victory for Nintendo, if only because there is very little to talk about on the Switch at the moment. Of course, there are many speculative articles, but it doesn’t feed the media cycle the way the Sony press conference did, where there was a price point, technical specs, and titles to discuss.

But to call it a win, I have to say I had to double check the number of unique websites that wrote about the consoles first:

websites_compared

The Nintendo Switch managed to secure coverage across more media than the PS4 Pro or the Xbox “Scorpio”, even if not in a massive way. Nintendo is clearly behind the two other console manufacturers, and it shows in the monthly tracking we do on the coverage of each platform, so being able to get this amount of attention is good for them. It is the biggest beat related to the Nintendo brand since we started tracking media coverage (January 2014), but it is still way behind what Sony and Microsoft gained for their biggest announcements in the period (usually around E3, but not exclusively, as the PlayStation Experience managed to build a lot of significant coverage the past couple of years too).

Where is the interest?

websites_compared_lg

Looking at the same metric (unique websites covering the announcement), there is a similar level of increased interest for the Nintendo Switch compared to the PlayStation 4 Pro across most languages. The notable exceptions being French and Spanish media, which covered this announcement in a bigger proportion than the other languages (and which makes sense considering the findings from the report on the different media landscapes) and Italian media where the increase was smaller than the other languages (and contrary to the same findings).

The websites parsed by the monitoring tool are also put in different categories and this is where an interesting pattern appears for this announcement:

websites_compared_mt

Nintendo is often seen as a family-friendly brand, one that has a wide appeal and name recognition outside of the video game industry. The bigger reach the Nintendo Switch announcement had with General Interest media would reflect that, and is quite significant here (note that the tool’s database is very much geared towards video games media and is not as exhaustive when it comes to media from different categories). But the significant reach the news had with websites qualified as Special Interest, is one I didn’t expect. Special Interest media cover a range of very specific topics, generally only tangentially related to video games. For example, it includes websites that focus on board games, “geek culture”, and science-fiction in its broadest expression. The news seems to have found a very strong resonance with those media compared to the “upgraded console” announcements.

All in all, this was a massive announcement for Nintendo, one on a scale that they don’t often have. And while it worked and found a significant reach in the media, it was not spectacular. Pokemon Go, at its highest week, saw a lot more coverage than the announcement of a brand new console. Of course, Pokemon Go was an extraordinary phenomenon, but so should be the reveal of your new device.

Here are the last couple of numbers to give some food for thought: at the time of writing this blog post, 5 days after the reveal, the Nintendo Switch reveal video on Youtube had 17m views; the Battlefield 1 reveal trailer had 22m views over the same time period.