
While I might have missed the symbolical January window to post about the past year, this review of Kickstarter in 2015 in numbers will hopefully still be of interest to all of you. Like for the blog post I did last year, I have put together a massive PowerPoint deck with tons of numbers and details across all the different categories of projects on Kickstarter. Unlike last year, I won’t discuss the game category in depth in this blog post though. But don’t be disappointed, I will make a dedicate games post for this shortly.
Kickstarter has grown 35% in 2015
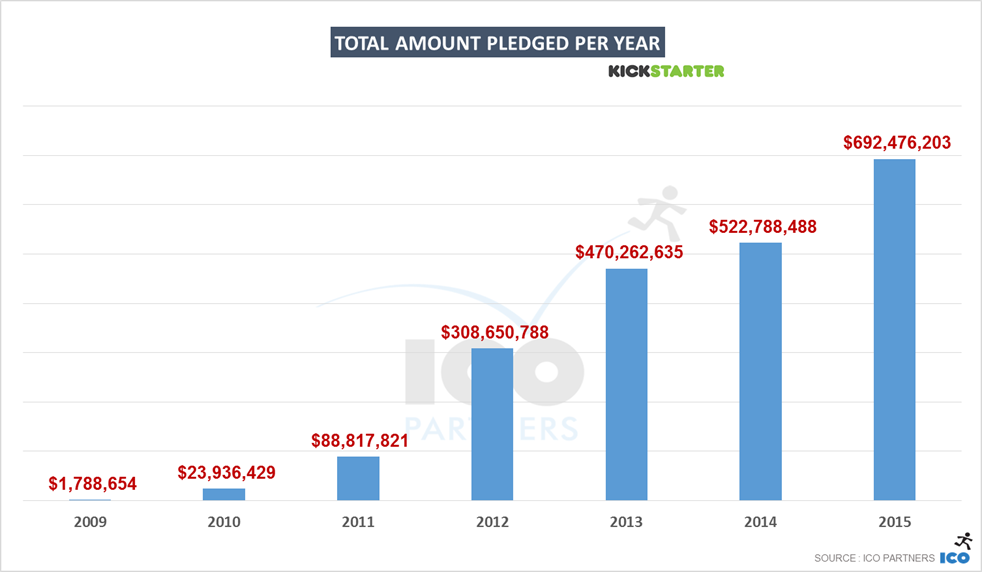
In 2015, the total amount of money going to funded projects increased by 35%. That’s $160m more than in 2014. And if you wonder what that means for the platform, that’s an extra $8m, just for their 5% fee (there is an extra fee for the payment processing) for a total of $30m for the year.
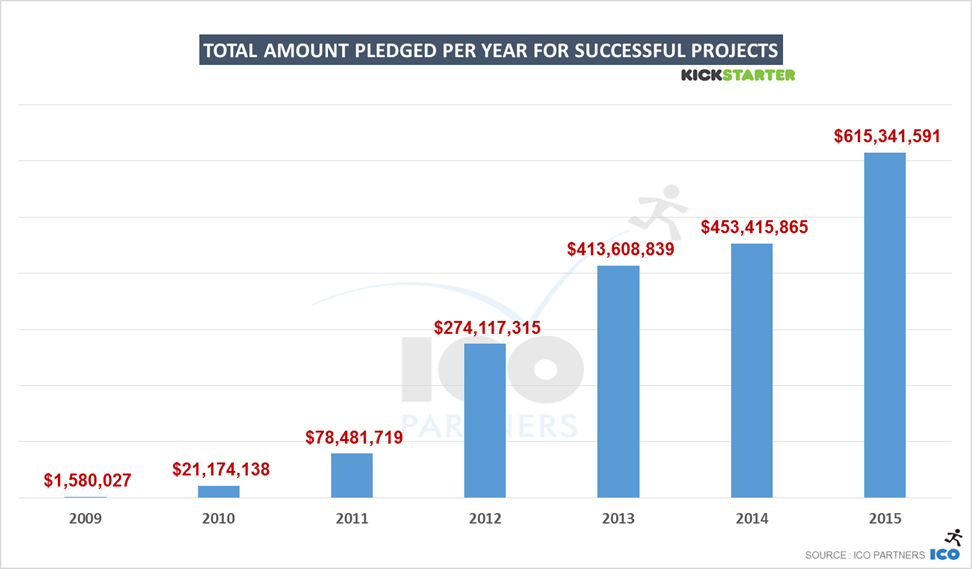
Financially speaking, there are two ways to look at the size of Kickstarter projects. Kickstarter usually talks about money pledged, meaning the amount of money that was promised to projects, not considering if those projects reached their objective or not. The other way is to only look at the money that was promised to projects that reached their goal successfully.
Because of the nature of crowdfunding and the way people back, the difference between these two numbers is not huge. Almost 90% of the money pledged actually went through to projects meeting their goals.
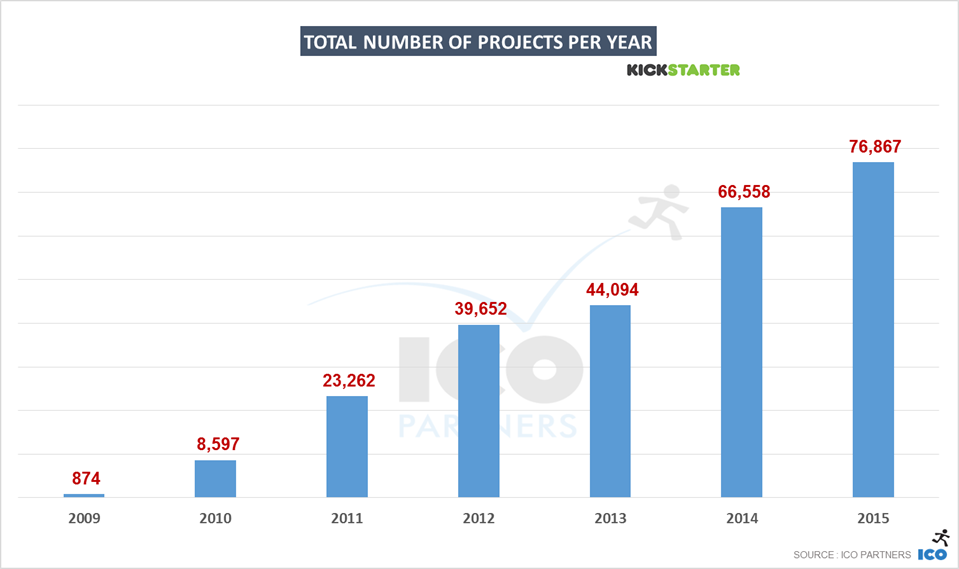
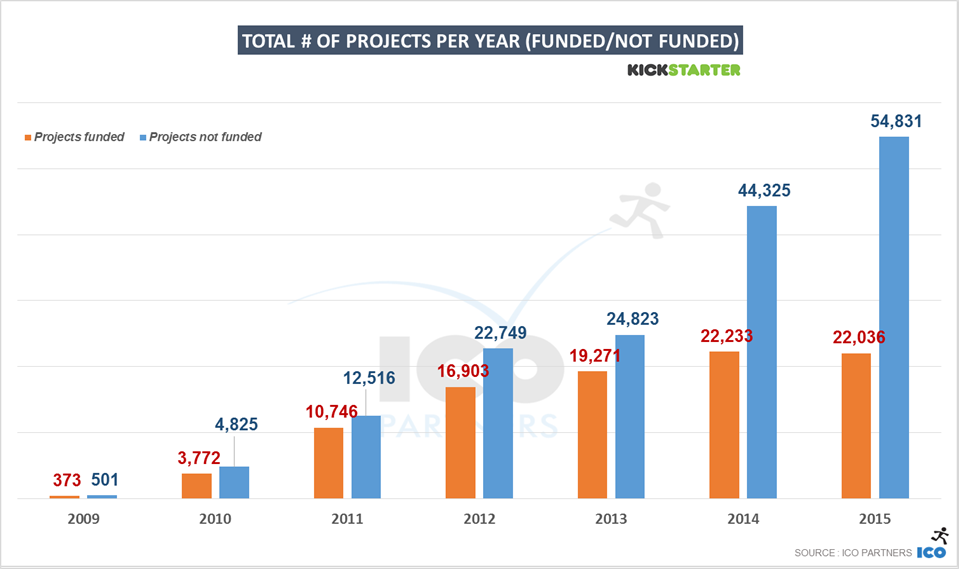
Looking at the total number of projects, we get a more precise picture: Despite the significant growth, the total number of projects that were funded stayed about the same (we are actually talking about a 0.9% decline). This is the first time since the platform launch that this happened, making the impressive financial growth last year clearly related to an increase in the average money each projects raised.
The growth of total number of projects is significant though, meaning more creators are coming to Kickstarter to finance their projects, but this doesn’t translate in more projects getting funded.
If you are not familiar with the format I usually use, the following graphs are showing the break down of projects based on the amount they have raised (in USD).
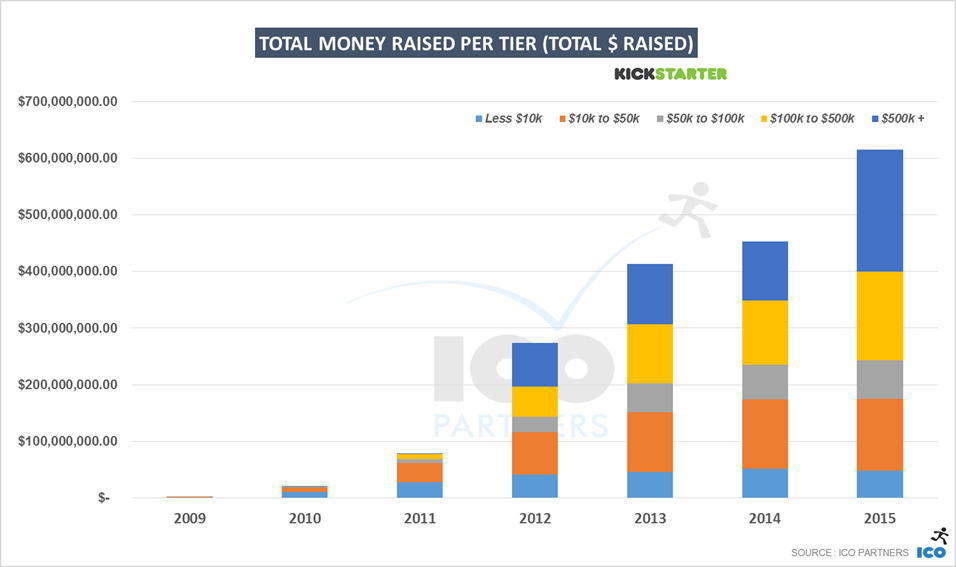

On the money raised, it has increased in all tiers except the lowest one (projects that raised under $10,000). Obviously the higher the tier, the more potential it has to raise more money, with no ceiling on the amount of money that can be raised by the higher tiers.
On the total number of projects per year, there is a decline for the under $10k tier, a negligible growth for projects between $10k and $50k, a significant increase for the projects between $50k and $500k, but more importantly, there were 75% more projects which raised more than $500k (from 80 to 140 projects).
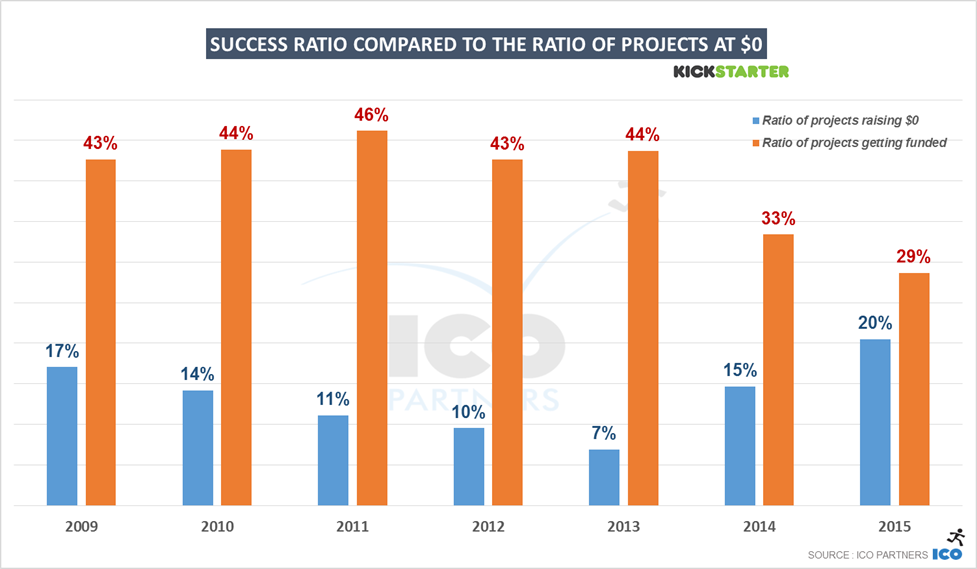
An incredibly interesting indicator is looking at the percentage of projects that raise $0. I call it the junk ratio and that might not be very kind, but it shows the proportion of projects that are so low quality, that nobody actually pledged on them. That means the person behind the project couldn’t convince their friends nor their family to at least pledge a little to show support.
We can see a form of gold rush coming to the platform, but it is probably a good thing this doesn’t translate in an increase of the number of projects getting funded. The wisdom of the crowd in action in a way.
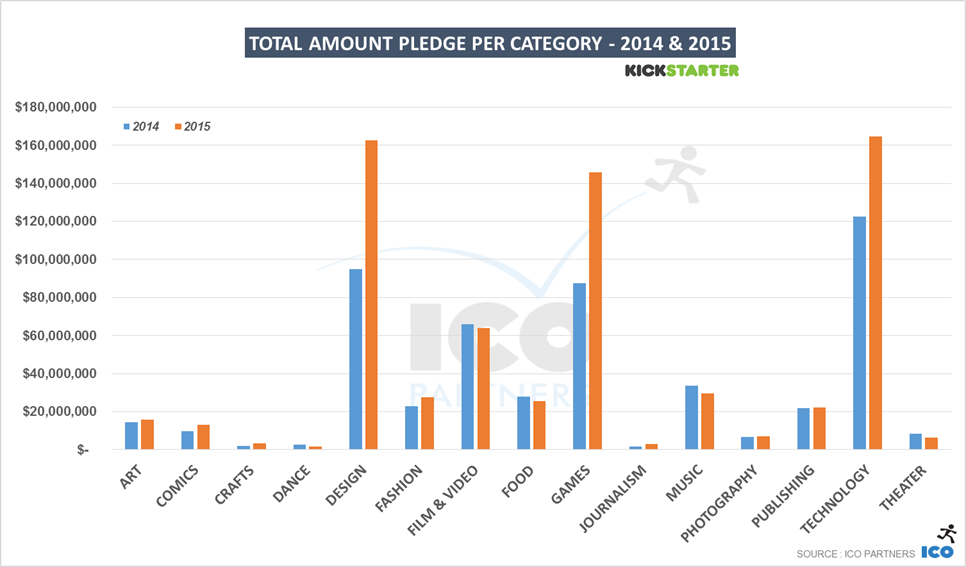
A lot of the growth of the past year happened thanks to projects in the design category, taking the number 1 spot in front of Technology and Games which are respectively 2nd and 3rd. Most of the other categories stayed at the same level they were in 2014.
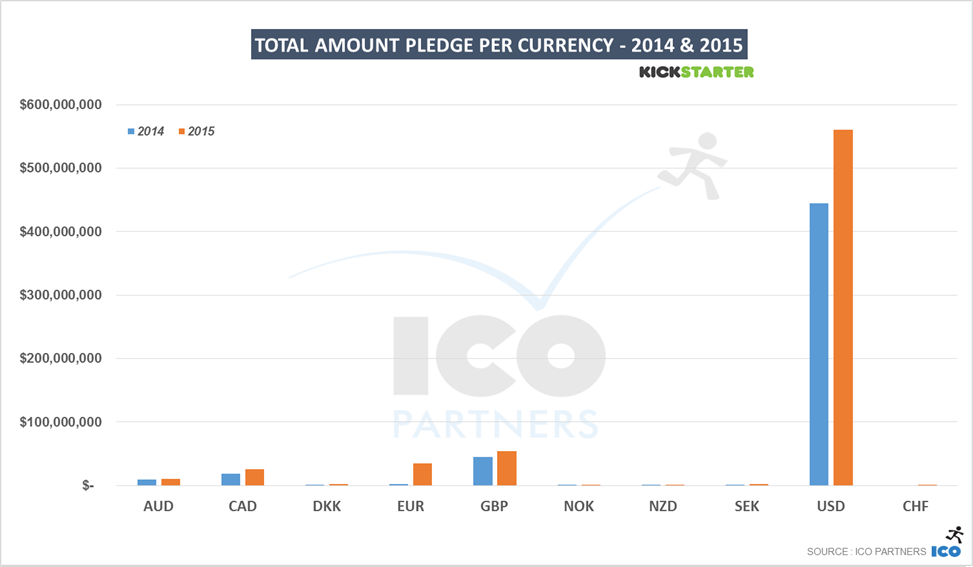
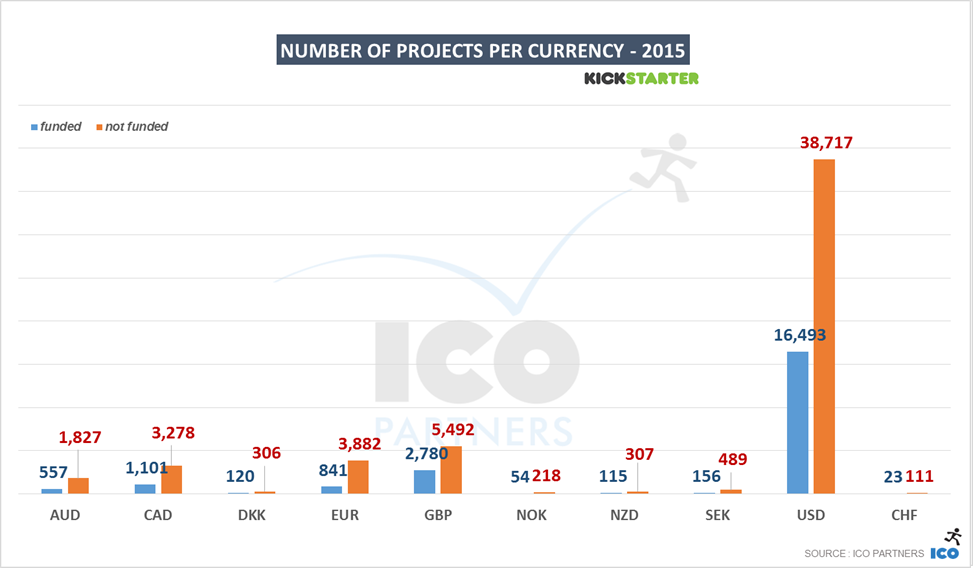
In 2015, Kickstarter expanded in many EUR countries, which saw a direct impact on the amount of projects and the money raised by projects in EUR. (Note: we can’t tell where the backers are from, those numbers are based on the currency the project is presented in)
EUR is 3rd currency on the amount of money raised, even if it is still 4th, behind Canadian dollars for the number of projects funded (despite more projects overall).
A look at the categories
Kickstarter asks creators to put their projects in different categories. This allows us to look at the different trends of each of those categories. While you can find a lot more details in the documents on Slideshare, I have summarized some key takeaways for each of them below.
Art
Bigger projects are becoming more common. In 2015, the number of projects in the $100k-$500k band doubled.
Crafts
A relatively small category, it has nearly doubled in a year. Woodworking is the single biggest subcategory outside of the generic Crafts one. Also, there is a Taxidermy subcategory.
Comics
2014 saw a significant drop in the money raised in this category. Last year it bounced back to its highest ever (money and number of funded projects). About half the projects in the Comics category get funded.
Dance
2015 was the worst year since 2011 for this category, which is also the smallest on the platform, even though for the first time a project raised more than $100,000. The number of projects that raised between $10,000 and $100,000 dropped down by half in a year. Interestingly, this is a category that seems to be very popular in the UK (48 funded projects last year, out of 295 in total).
Design
I mentioned it at the beginning, 2015 was a big year for design projects. The category is the one that raised the most money in 2015 and it grew across all sizes of projects as well. Also notable, the projects in EUR are only second to projects in USD in total money raised in this category (GBP is still 2nd in the number of successful projects).
Fashion
This category is still growing steadily year-on-year. Notable though, the ratio of junk projects (projects that raised $0) is quite high at 28% (the average is 20% across all categories for 2015).
Also. There is a Pet Fashion subcategory.
Film & Video
Once the leading category of projects on the platform, for the second year in a row it is seeing a decline, both on the amount of money raised and the number of projects funded, and this is across all ranges of projects. This doesn’t look like a bubble bursting though. Also interesting, this is a category that’s not showing a lot of projects in EUR. Like a couple of other categories, I suspect this type of very localized content is already quite strongly supported on other platforms that were present locally way before Kickstarter launched there. Finally, across the many subcategories, Documentary is the largest with 22% of the funded projects and 37% of the money raised.
Food
The Food category saw a small decrease from last year, but nothing incredibly drastic. The category is not incredibly popular on the EUR platform. Important thing I learned though: there is a Bacon subcategory.
Games
As mentioned previously, I plan on a whole blog post for this category. Interesting to note though, 2015 has been the best year ever for this category, both on the amount of money raised and the number of successfully projects, and the Tabletop Games subcategory is the largest by a significant margin.
Music
This category follows the same pattern as the Film & Video category: a slight decline for a 2nd year in a row) and EUR is the 4th currency. For the music genre, Country & Folk subcategory is #1 for money raised, and the Rock subcategory is #1 for funded projects.
Photo
The category saw a slight growth from 2014. However it is one of the categories with the largest ratio of junk projects, with 26% of the projects collecting $0.
Journalism
This is quite a small category (second to last), but it actually grew significantly from last year (+63% in money pledged). It is also the category with the largest proportion of junk project, with a third of all projects not raising a single dollar.
Publishing
While the category grew when you look at the money pledged to its projects, the number of funded projects actually declined slightly. It seems still fairly stable though. Like the Music and Film & Video categories though, EUR projects are representing a fairly small number of the money raised, being the 4th currency in amount of money pledged, just slightly more than projects in Australian Dollars. It has a fair share of junk projects with 25% of the projects at $0 pledged to them. The largest subcategories are Artbooks for the total amount of money raised and Children’s Books for the number of funded projects.
Technology
The second largest category on the platform, Technology grew in the past year both on the number of funded projects and the total amount of money pledged to its projects. There were about as many funded projects in that category using the EUR as their currency, as they were using GBP.
Theater
A fairly small category, it has declined last year to its lowest since 2011. Very interesting to note that it is incredibly strong in the UK with more than a third of the funded projects being in GBP.
All the slides
A note on the methodology
Like for all previous blog posts on the topic, we have been using the data on the Kickstarter pages themselves (with the help of Potion of Wit) and the collection method is not without its own issues. Please consider all of the numbers presented here as estimates.
BUT. I would like to point everyone to this blog post from Kickstarter. In it, they present the successes of 2015 in the Game category and a few numbers. Our own numbers are incredibly close: 2,259 funded projects (Kickstarter) / 2,258 funded projects (ICO); $144.4m pledged (Kickstarter) / $145.6m (ICO). I am very happy with those margins of error.


https://www.kickstarter.com/1billion
2014 is 1 billion
you said
Because of the nature of crowdfunding and the way people back, the difference between these two numbers is not huge. Almost 90% of the money pledged actually went through to projects meeting their goals.
but its 453 millions for your 2014. is there an error somewhere?
Two things:
do you have a report including 2016 data?
I do: https://icopartners.com/2017/01/kickstarter-2016-deep-dive-games-category/