
Last year I did a general overview of Kickstarter across all categories for 2013 and now seems like a good time to go through a similar exercise for 2014.
I should start with the disclaimers though. In 2014, Kickstarter made a lot of changes to their website, changes that making data collection not as straightforward as before. I strongly suggest to look at this year’s numbers as estimates – all the trends they highlight are probably true but there might be a few inaccurate ones in there too, especially when the related data sample is rather small. Just keep it in mind.
You can find a complete, category per category, Slideshare presentation at the end of this post.
How good was 2014?
It all depends who you are I guess. If you are Kickstarter, 2014 was a good year. More money had been pledged on the platform than ever before.
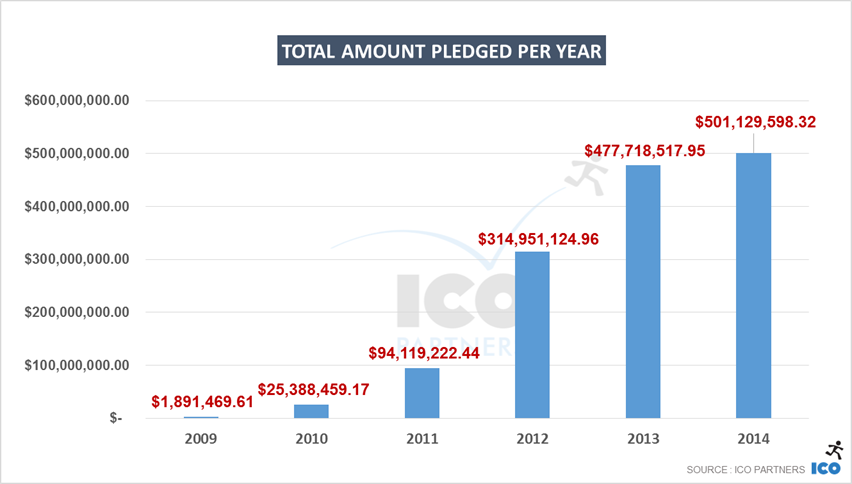
While the growth in 2014 was not the leap observed in 2012 or 2013, it was still growth. Considering the remarkable successes of the two previous years, maintaining the trend is not a small feat and in that regard, we can probably consider this another winning year for Kickstarter.
For the creators on the platform, the outlook is a bit different.
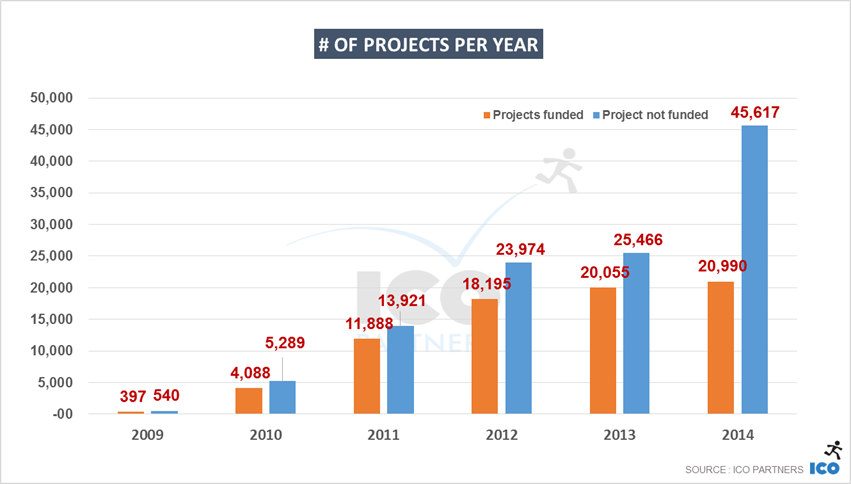
On one hand, there has been more projects submitted to the platform than ever before: an impressive 46% increase from the previous year. When put side-by-side with the number of successfully funded projects, a 5% year-on-year increase, it tells a different story.
Kickstarter looks to have reached the point where the wider audience is fully aware of its existence. As a result it attracts more creators than ever, and we are probably seeing lower quality projects getting submitted in larger numbers.
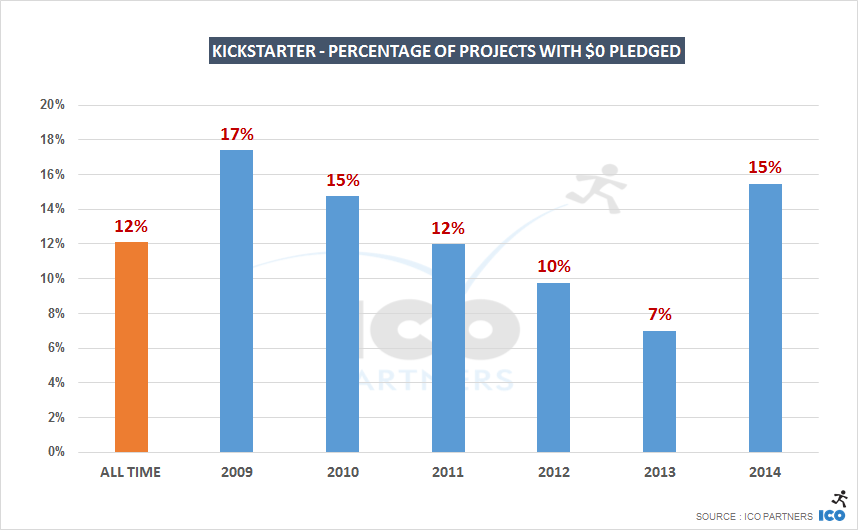
This is very much illustrated by the percentage of projects that had $0 pledged towards them:
Who was it good for?
Back in September, I looked at how 2014 had been for Video Games on Kickstarter, and I did some projections showing that the numbers were going down from 2013. I won’t go in depth in any of the subcategories, but this is an interesting overview across all categories, showing their progress from 2013:
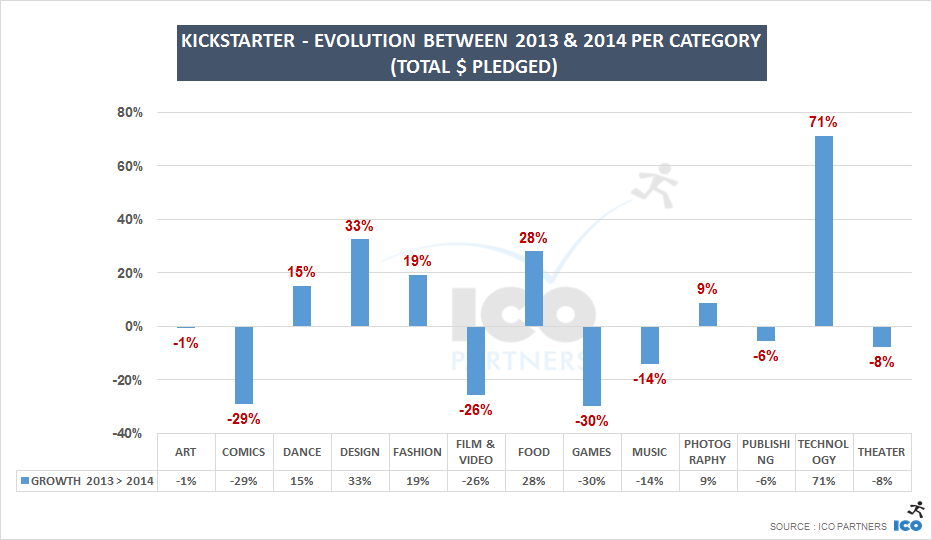
There has been a significant drop in the amount of money pledged for Comics, Films and Games on the platform in the past year. On the other hand, it was a fantastic year for Technology projects while Food and Design projects also performed very well.
But that’s only half of the story. As we have observed in the past, it is very easy for a few very large projects to weigh heavily on the overall amount of money pledged in one category.
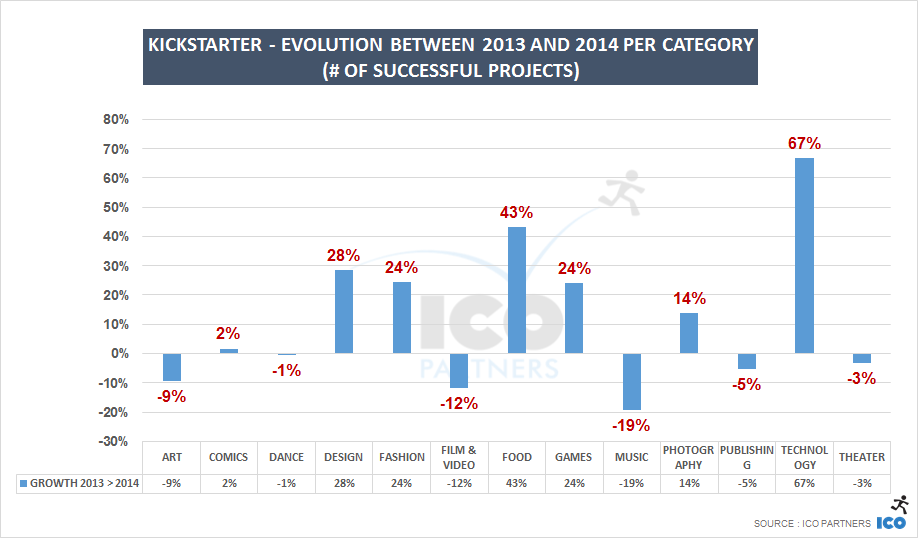
Year-on-year, looking purely at the number of funded projects, the only categories that saw a significant dip are Art, Music and Films. This helps illustrate that Games saw more projects getting funded than in 2013, despite gathering less money…
In a way, this means (in Games at least) that Kickstarter is getting more democratic and benefits more creators with projects with different scopes. And just to illustrate that thought, here is the Games category broken down per funding tier:
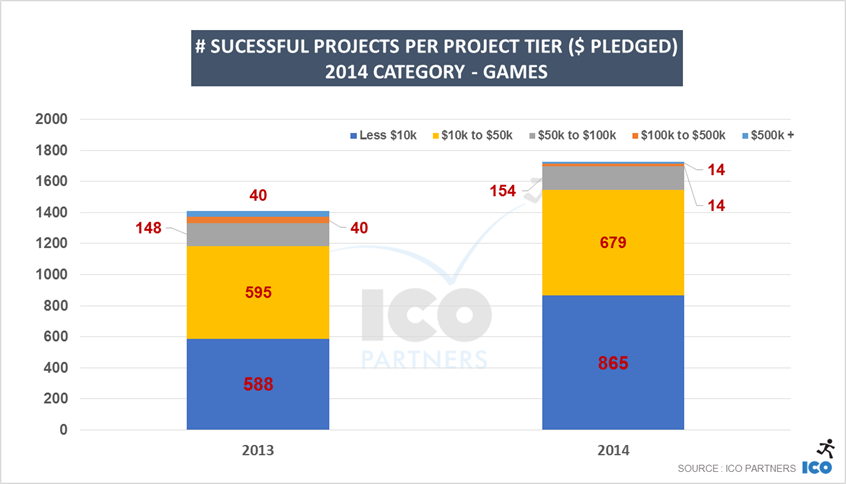
You can find this kind of break down for all categories in the Slideshare presentation…
All things considered though, we can say that it was a good year for picnic lovers.
What changed in 2014?
Kickstarter added another four currencies to its platform and opened projects to five new countries: Netherlands, Sweden, Denmark, Norway and Ireland.
The overall impact on the platform was not very significant:
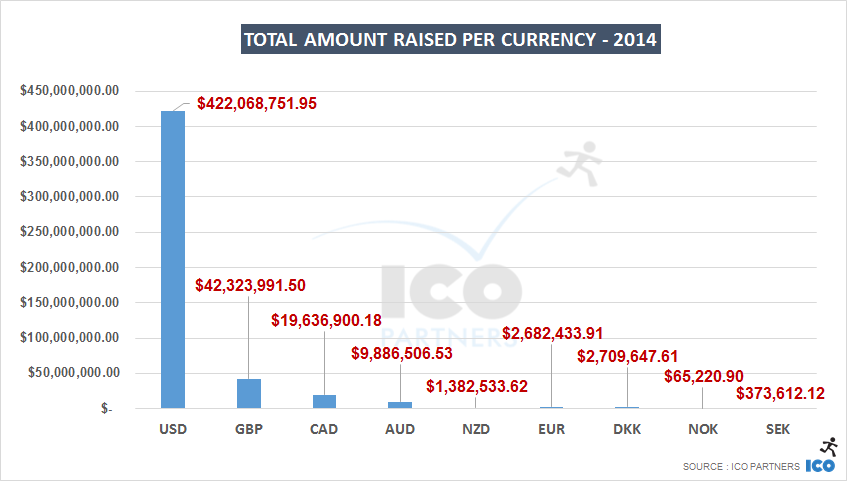
The projects in GBP are still doing relatively well – along the same scope as last year.
It is worth noting that the Danish projects, the best funded of the newly added Scandinavian countries, did so through a few projects that raised more than $250 000 (including the very well performing Sitpack project). Anecdotally, 75% of those projects are Design projects. Denmark, right?.
Meanwhile, there hasn’t been a single EUR projects above the $250 000 line. Of course, large EUR countries such as France and Germany don’t have a direct access to Kickstarter and generally create their projects either through USD or GBP. It is worth noting however that the EUR integration didn’t seem to have much of an impact on Kickstarter’s development.
2015 will be interesting in regards to currency. One challenge that Kickstarter faced was that payments in USD were made through Amazon Payments, while all the other currencies were using an in-house solution. It meant that existing backers, with their card on record on Amazon, had to go through an extra step to be able to pledge money to a project not in USD. Now, all projects will share the same payment platform, regardless of currency. It should help the “exotic” currencies and remove a potential friction point in the process. On the other hand, no longer using Amazon Payments may have a negative impact too. Only time will tell in that respect.
Kickstarter in 2014 – Across all projects categories
UPDATE – I had a chat (very friendly) with Kickstarter and they highlighted that it was hardly fair to compare video games and tabletop games between 2013 and 2014 the way I did as they have added 5 new subcategories that further dilutes projects and increase the perceived dip for the two historical main subcategories. I have reviewed my numbers and added the new subcategories to the relevant pre-existing ones.
The slides represent this change now. To be clear, only the last slides were affected – the Video games and Tabletop Games sections.


Trackbacks & Pingbacks
[…] of Kickstarter in 2015 in numbers will hopefully still be of interest to all of you. Like for the blog post I did last year, I have put together a massive PowerPoint deck with tons of numbers and details across all the […]
[…] my last blog post on Kickstarter, I explained how there was a significant drop in the amount of money that went to video games over […]
[…] It was a tough year for tabletop game Kickstarters in 2014, as the dollars raised declined 6%, even as the number of projects funded climbed nearly 40%, according to a report released by ICO Partners. […]
Leave a Reply
Want to join the discussion?Feel free to contribute!