
As has become the tradition, I have made a deep dive into the Kickstarter data we collect so I can present to you a review of the past year for the crowdfunding platform.
For the readers used to my focus on games, this is my one article a year where I actually widen the scope of the research, I will follow it up with an article specifically on games next week (and if you can’t wait, you can go read my article on GI.biz I wrote on the topic of crowdfunding in 2016). If you have a curious mind, you can check last year’s post, but I will do a lot of year-on-year comparisons here.
First year of decline for Kickstarter
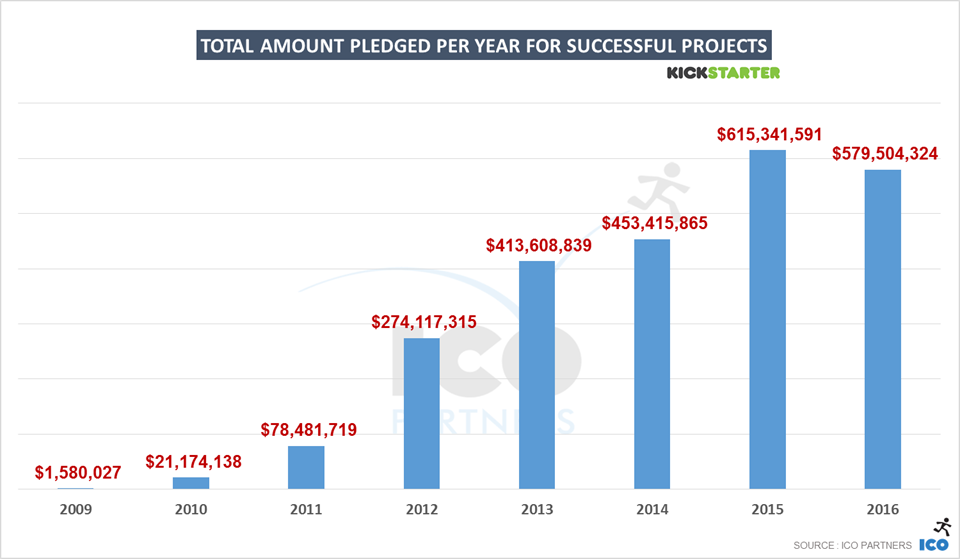
After many years of constant growth, for the first time Kickstarter saw a decline last year.
It would be very hard for me, with the limited data set available, to fully explain why. As I am only looking at Kickstarter, I can’t tell if the decline is due to the enthusiasm of the early days of the platform wearing off, the competition eating into Kickstarter market shares, or crowdfunding building an image for unreliability and losing its wider appeal. I can however share my other findings, time will tell if this decline is a trend that will continue or if it will stabilise (a bit more on that later though as we have some indicators).
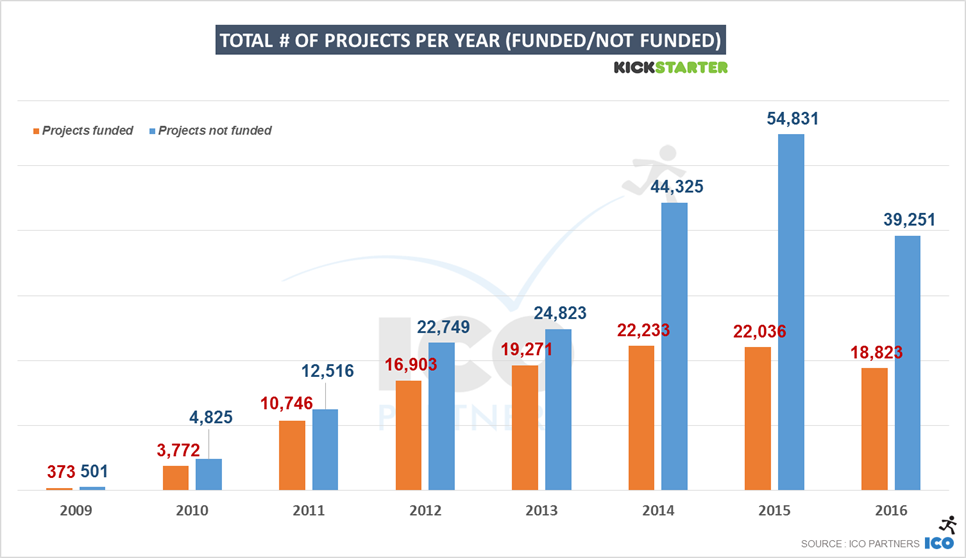
The first interesting point on the decline observed is the fact that the drop in the number of funded projects (- 14.5%) is much more significant than the drop in the total amount of money raised in the platform (-7%). That means there is a higher concentration of funding per project than in 2015 – if on average projects have raised more, but the platform saw an overall decline, it would seem to indicate that we might be heading towards either a more demanding audience (the quality of the campaigns need to reach a higher quality bar to meet its goal), or more professionally built campaigns are launched on the platform (raising more money and being more reliably successful), or more likely, a combination of both.
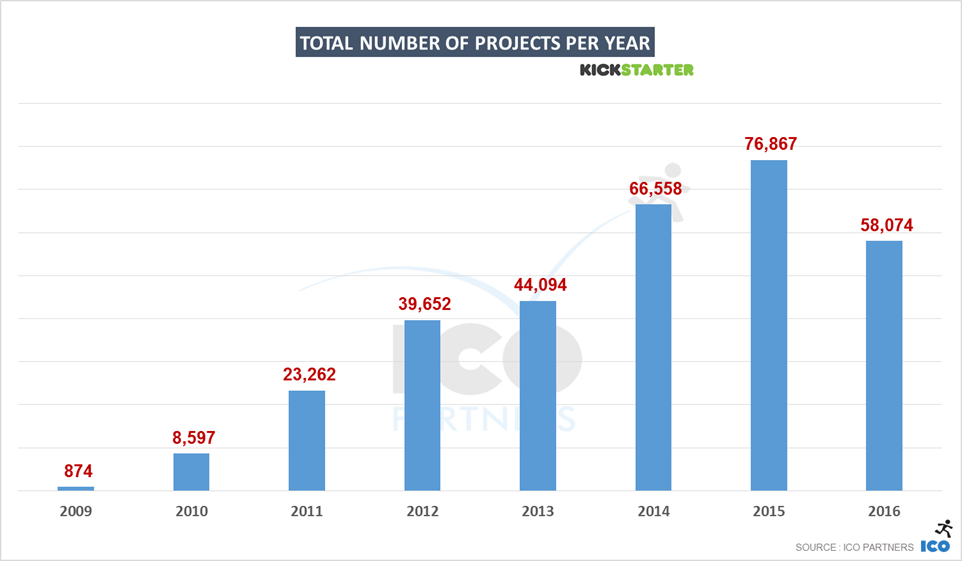
What is also noteworthy is that the drop in the number of projects is bigger (-31%) than the drop number of funded projects. This is certainly coming from a more general realisation that a Kickstarter campaign is not an easy money grab. We can see the percentage of projects getting $0 (my metric for “junk projects”) has dropped in the last year, from 20% of all the projects on Kickstarter in 2015 to 14% of all projects in 2016. This feeds nicely the idea that projects on Kickstarter are getting more professional or more serious overall.
If you are not familiar with the format I usually use, the following graphs are showing the break down of projects based on the amount they have raised (in USD).

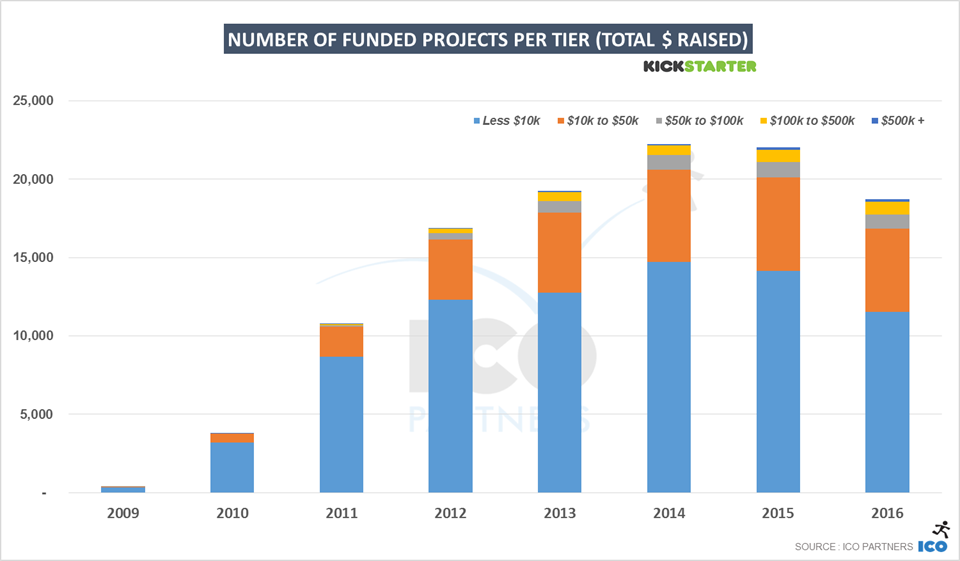
In terms of the number of funded projects, the biggest decline observed is for the lowest bracket, projects that raised less than $10,000. This group saw a -19% decline both in total number of funded projects and total amount of money raised by these projects. This is obviously not caused by more smaller projects managing to break through the higher bracket, but by the decline in the number funded projects for all the next brackets. Where we see an increase is in the number of funded projects in the brackets of “$100,000 to $500,000 raised” and “More than $500,000 raised”, despite the overall decline seen on the platform. There were more projects raising more than $100,000 in 2016 (978 projects) than any year prior. This is for me another sign of Kickstarter campaigns becoming more and more sophisticated and professional, and managing to raise more money than the prior years as a result.
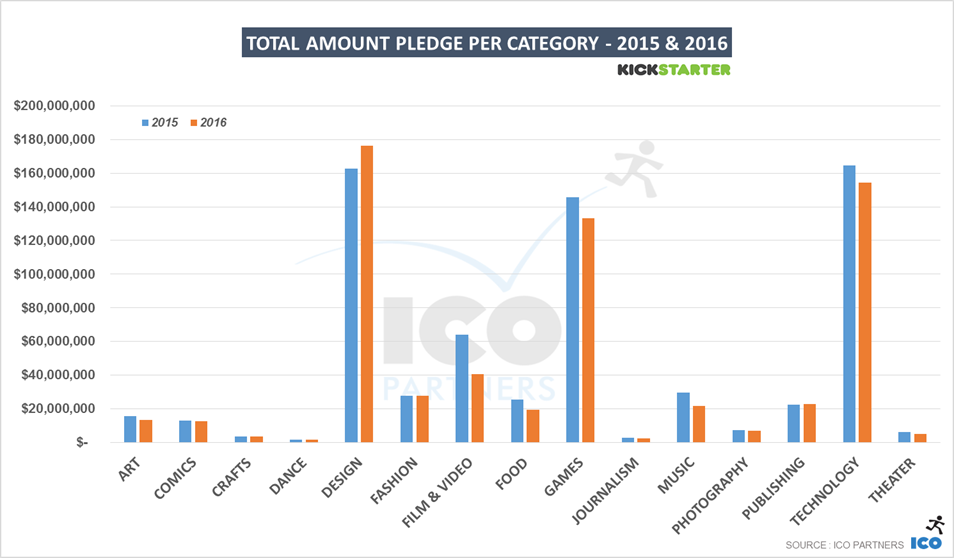
If you have a particular interest in a specific category, you can find slides with detailed data for each one of them at the end of the article.
Looking how each category performed on the platform is always very interesting and says a lot to what happened on the platform. All the different categories exist in their ecosystem and microcosm, and the performance of one category could very easily contradict platform-wide trend.
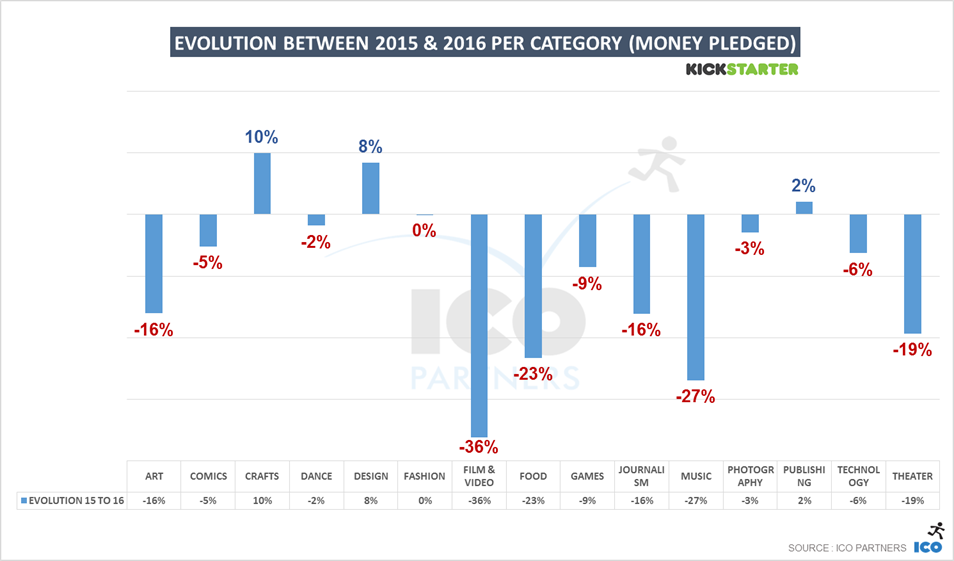
In 2016, there are only 3 categories that saw a growth in the total amount of money raised: Crafts, Fashion and Publishing. Crafts is a very small category overall and as such, its performance is easily subject to variation. Publishing only saw a very small growth year-on-year (+2%), but this was only true for the total amount raised, as the number of funded projects declined (-4%). The only category that saw a proper growth in 2016 was the Design category, which grew +8% in total amount raised and +5% in the number of funded projects.
All the other categories raised less money in 2016 than in the previous year, but the decline is sharper for some. Both the Film & Video category and the Music category are leading the decline in terms of money raised. Interestingly, these two categories used to be the leading ones on Kickstarter (prior to 2014), and their continuous decline is probably the most worrying. It might be that they are creating a pattern that the other categories currently leading on Kickstarter will follow in the coming years, or they might be of a nature that makes it particularly easy for Kickstarter competitors to snatch market shares from them, or they might have an ecosystem that realised that crowdfunding wasn’t as needed as for other projects (specifically, I am personally thinking that both Films and Music have existing and very solid funding systems, while this is not necessarily true for other creative environments). As stated earlier, the data set I am looking at doesn’t provide a proper answer to this question.
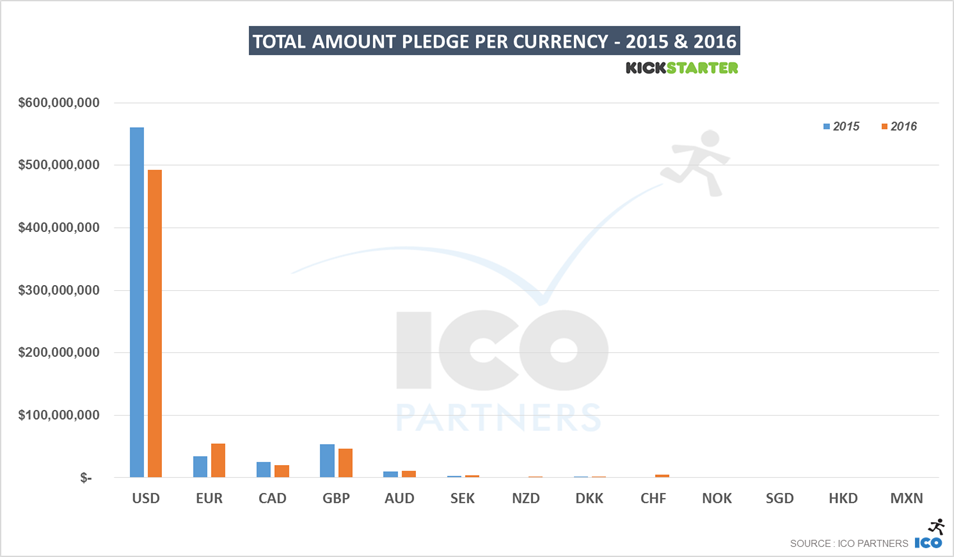
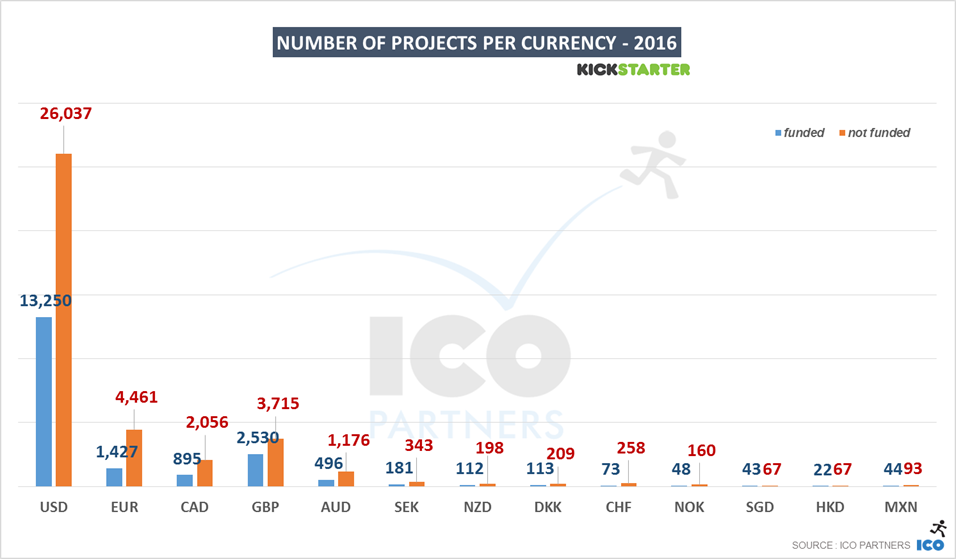
Looking at the currencies in which the projects are run, it is quite obvious that Kickstarter is still very much an American platform, even the EUR has now become the second currency in terms of total amount of money raised. EUR projects are still behind the GBP for the total number of funded projects though, highlighting the fact that EUR projects that decide to go on Kickstarter are probably ones that are ambitious and with a look to an international audience. I suspect many smaller projects (and more local projects) choose to go on other platforms that have been present locally for longer. This is still a win for Kickstarter in many ways as it managed to grow in a region where it has established competitors.

This is a stacked area graph showing the number of projects per week on Kickstarter, funded and not funded.
End of July/beginning of August 2014, something happened that boosted the number of projects launched on Kickstarter, but with little to no impact on the number funded projects on the platform. I have only very little evidence of this, but I think this was all due to the Potato Salad campaign. It was heavily talked about in the media and it painted Kickstarter as a platform where money was easy to raise. Certainly if a guy can get $55,000 for a potato salad, my own awesome project should be very easy to fund. The reality is of course much more harsh, but Kickstarter could see the effect on its number of project for 18 months. This flood of projects might have also had a negative impact on Kickstarter’s image, and the fact that there are fewer overall projects submitted might not be such a bad thing for them.
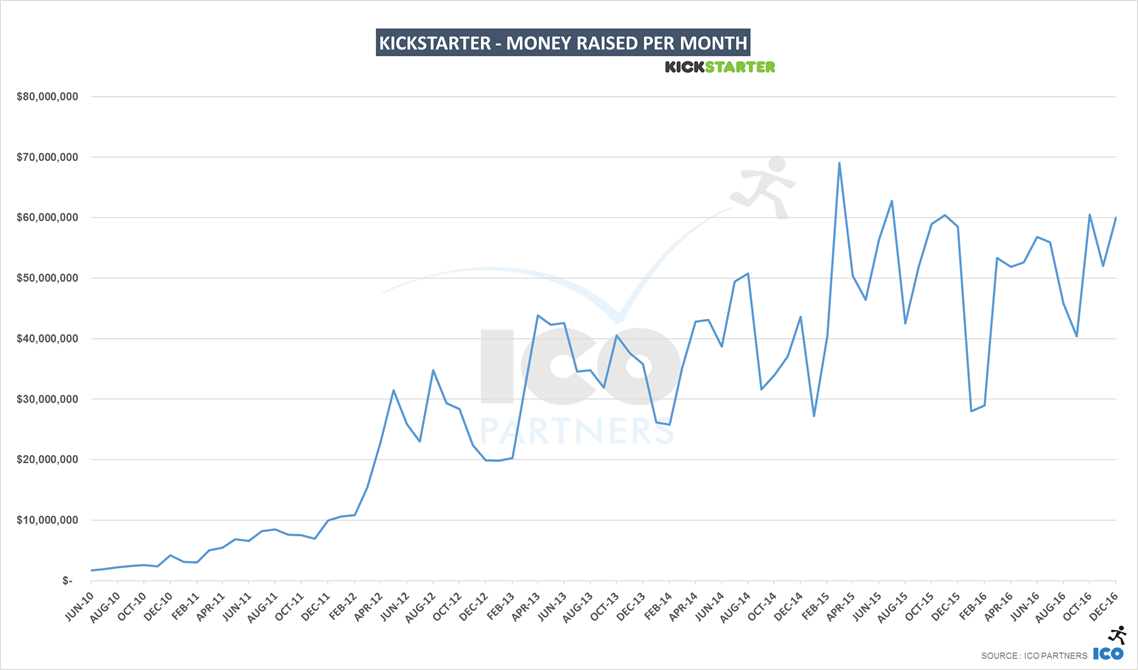
Finally, to conclude my analysis of the past year on Kickstarter, I wanted to share a more granular graph of the evolution of the performance of the platform over time. Looking at the amount of raised every month, last year decline doesn’t appear as a phenomenon that goes on worsening. February 2016 was the one month with a particular decline compared to the previous year and bears most of the year-on-year decline. So while there is also no hidden growth, this is the one set of data that makes me feel relatively optimistic that we are not seeing a bubble bursting, and I have very much in mind a very interesting talk from David Edery at GDC in 2010 on video games platforms, and the pattern he observed where some of them go through an “inevitable misery” decline before a “triumphant return”.
A look at the categories
Kickstarter asks creators to put their projects in different categories. This allows us to look at the different trends of each of those categories. While you can find a lot more details in the documents on Slideshare, I have summarized some key takeaways for each of them below.
Art
There was a significant decline in the total number of projects funded. Interestingly though, most of the drop in the money raised was on GBP and EUR project, there was a slight growth of the money raised in USD by contrast.
Crafts
A relatively small category, it was still growing this year. The number of projects that raised more than $50,000 went from 3 to 9.
Comics
The money raised in that category saw a small drop (-5%) year-on-year, but 2016 is still the second best year ever for that category. It is interesting to note there were no $500,000+ project this year and the total number of funded projects grew +9%.
Dance
While the amount of money raised has been comparable to 2015 (+3%), the number of funded projects dropped by -12%. But more interestingly, the number of projects launched dropped by a whooping -30%. [loss of KS zeitgeist?].
Design
After a stellar growth in 2015, the Design category is one of the few that kept growing in 2016. The growth happened mostly with non-USD project (the total amount raised for USD projects declined a bit in 2016), especially with the EUR projects, following the trend observed last year. Like for most categories, the total number of projects launched on the platform declined, even though more projects got funded in the end.
Fashion
The Fashion category is very stable year-on-year. Almost the same amount of money was raised, even if a fewer number of projects got funded (-11%). This was the first year where 4 Fashion projects raised more than $500,000, helping maintaining the total amount raised.
Film & Video
2016 wasn’t great for this category. In terms of total of money raised, it dropped below the level of 2012 (-38% from 2015’s amount). The number of funded projects also saw a significant drop from last year (-25%). The decline is seen at all Tiers of funding. Small or big, there were fewer Films funded on Kickstarter in 2016. The one subcategory that saw a significant increase is the Animation subcategory, where $3.6m were raised in 2016 compared to $1.8m in 2015.
Food
The Food category dropped below the $20m per year mark in 2016, with a sharp decline of the number of funded projects (-32%). Projects in EUR were some of the few that saw growth from the previous year, raising more money in total than the British and the Canadian projects.
Games
Like last year, I will do a deeper dive into this category next week. For now, I will note that following the trend, less money was raised in this category than during the previous year. However, the total number of projects funded actually grew, and the decline in the total amount raised was mostly true for projects run in USD. Projects in EUR and GBP raised more money in 2016 than in 2015. The percentage of the projects seeking funding and getting in also grew to 37%, the best success ratio in that category since 2010.
Music
This category follows the same pattern as the Film & Video category: a significant decline for the 3rd year in a row. Both the total amount of money raised, 2016 was the worst performing year since 2011, but the total number of projects funded, it was the worst year since 2010. For the music genre, Country & Folk subcategory is #1 for money raised as well as for number of funded projects in 2016.
Photography
The category has been stable in terms of total amount of money raised, mostly thanks to 2 projects raising more than $500,000, as the total number of funded projects here again saw a decline (-15%).
Journalism
This is still a small category, and while it also saw a decline in both the total amount raised and the total number of funded projects, this was also the very first time Kickstarter had projects raised more than $100,000 in that category. And it wasn’t just one project, but four of them, highlighting one of this year’s trends that a significant part of the decline on Kickstarter is affecting the smaller projects on the platform.
Publishing
Like last year, there was a slight drop in this category’s total number of funded projects, however, the total amount of money raised did see an increase (+4%). All that growth came through projects in EUR and… in AUS (Australian Dollars)! Like for many categories, the drop in the number of projects launched on the platform has declined way more (-28%) than the decline in the number of funded projects (-4%).
Technology
After a stellar year in 2015, the Technology category saw a small decline in the total amount of money raised (-1.5%), and a more significant decline in the number of funded projects (-18%). Again, this comes with an even bigger decline in the total number of projects submitted on the platform (-28%). The one axis of year-on-year growth was for projects in EUR, which was the second currency on the platform, raising more money than projects in GBP for the first time. Also interesting to note was the growth of the Wearable subcategory (+11% money raised).
Theatre
A fairly small category that last year dropped to its lowest amount of money raised since 2011. In 2016 the decline continued, with this time even fewer projects getting funded than in 2011. And once again, the one area of growth was with projects in EUR, that raised more money than in 2015.
All the slides
A note on the methodology
Like for all previous blog posts on the topic, we have been using the data on the Kickstarter pages themselves (with the help of Potion of Wit) and the collection method is not without its own issues. Please consider all of the numbers presented here as estimates.


Trackbacks & Pingbacks
[…] were successfully funded, compared with more than 54,000 in 2015, according to research firm ICO Partners. The business generates sales by taking a 5 percent cut of successfully funded […]
[…] promised last week, here is a deep dive into the Games category on Kickstarter for the year 2016. The format will […]
Leave a Reply
Want to join the discussion?Feel free to contribute!