With gamescom behind us I now have some time again to look into the media trends in the games industry. I will do a writeup on the effect of gamescom itself, the way I did one for E3, but in the meantime here is the data for the month of July.
Platforms
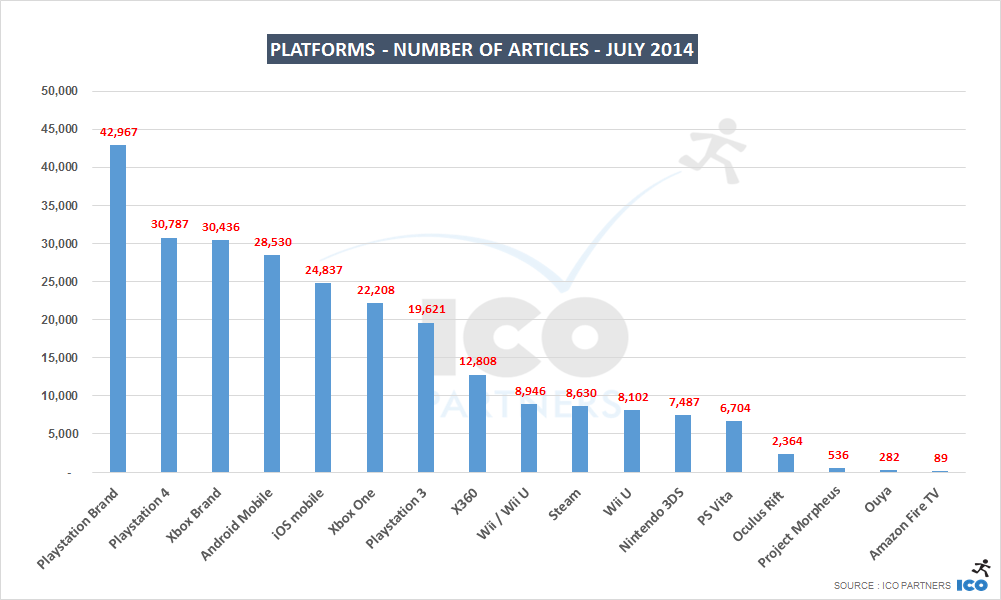
Overall, we can see a drop in console mentions as June was benefiting from the extra media attention E3 brings. The same trends remain though, with the PS4 getting about 30% more coverage than the Xbox One. We can notice the effect of the Google I/O effect, taking it well above of iOS for the first time since I started tracking them.
https://icopartners.com/newblog/wp-content/uploads/2014/07/slae2.png256710Thomas BIDAUXhttps://icopartners.com/newblog/wp-content/uploads/2020/04/CRUSHCREATIVE_ICO_BRANDING_LOGO_NavyWhite-01-e1586189748878.pngThomas BIDAUX2014-07-28 10:46:192017-01-27 07:06:54Summer sale – 50% Reduction on the Market research on Turkey
After our recent PR monitoring blog post got some extra attention, I thought I ought to make a post about the tool itself, how it works, its limitations and what may be missing at the moment.
This post will be updated as our monitoring evolves, and will serve as a reference to answer questions on the data collection and the meaning of some of the things we share.
TL;DR – The tool is not perfect. Some games are much harder to track than others. We constantly try to improve on all fronts and are very aware of the current weaknesses of the system.
The Media Monitor
That’s how the tool is called internally. It has evolved from the tool set that we used internally to support the work PR team carries out for our clients. Despite the first version being about a year old, a lot of the features have only been developed recently as it is not a core partof our day-to-day work. Having the tool working for that long though has proved very useful in identifying seasonal patterns (or the lack of), but we are still limited in the games we are properly tracking.
So far we have about 6,000 websites in our database (across 28 languages) – the Media Monitor is currently tracking about 3,500 of those websites.
For those websites that are not tracked, it is because of different reasons. Some websites we don’t track because it would be too complicated technically (or rather, we are using the method that allows us to track the most sites at the same time at the moment). Some websites we don’t track because we have a few bugs we need to iron out. And finally, some websites we decided not to track at all because of the nature of their content.
Every single website in the database is qualified – we keep the Alexa ranking, the language it is written in, and give every site a “media type” to allow us to analyse further the results of the work that is done. We have removed from the Media Monitor two types of websites: content farms (websites that have zero original content and generally publish automated reposts other websites’ content) and fansites (website dedicated to one or a few very specific games and don’t treat any others). In the first few months of monitoring we found such sites really skewed the results we were getting and so they had to go.
The trackers
We currently have more than 950 individual trackers (also referred to as alerts sometimes). Each of these trackers is doing a full text search for key words. We have trackers for a lot of different things at the moment:
Specific games
Game franchises
Hardware devices
Video game companies
Personalities
Events
Weird, ultra specific things that we want to track individually for whatever reason
90% of the trackers work very efficiently. They don’t return many false positives (ie: articles that use key words but on an unrelated subject) and they don’t miss much of the relevant articles.
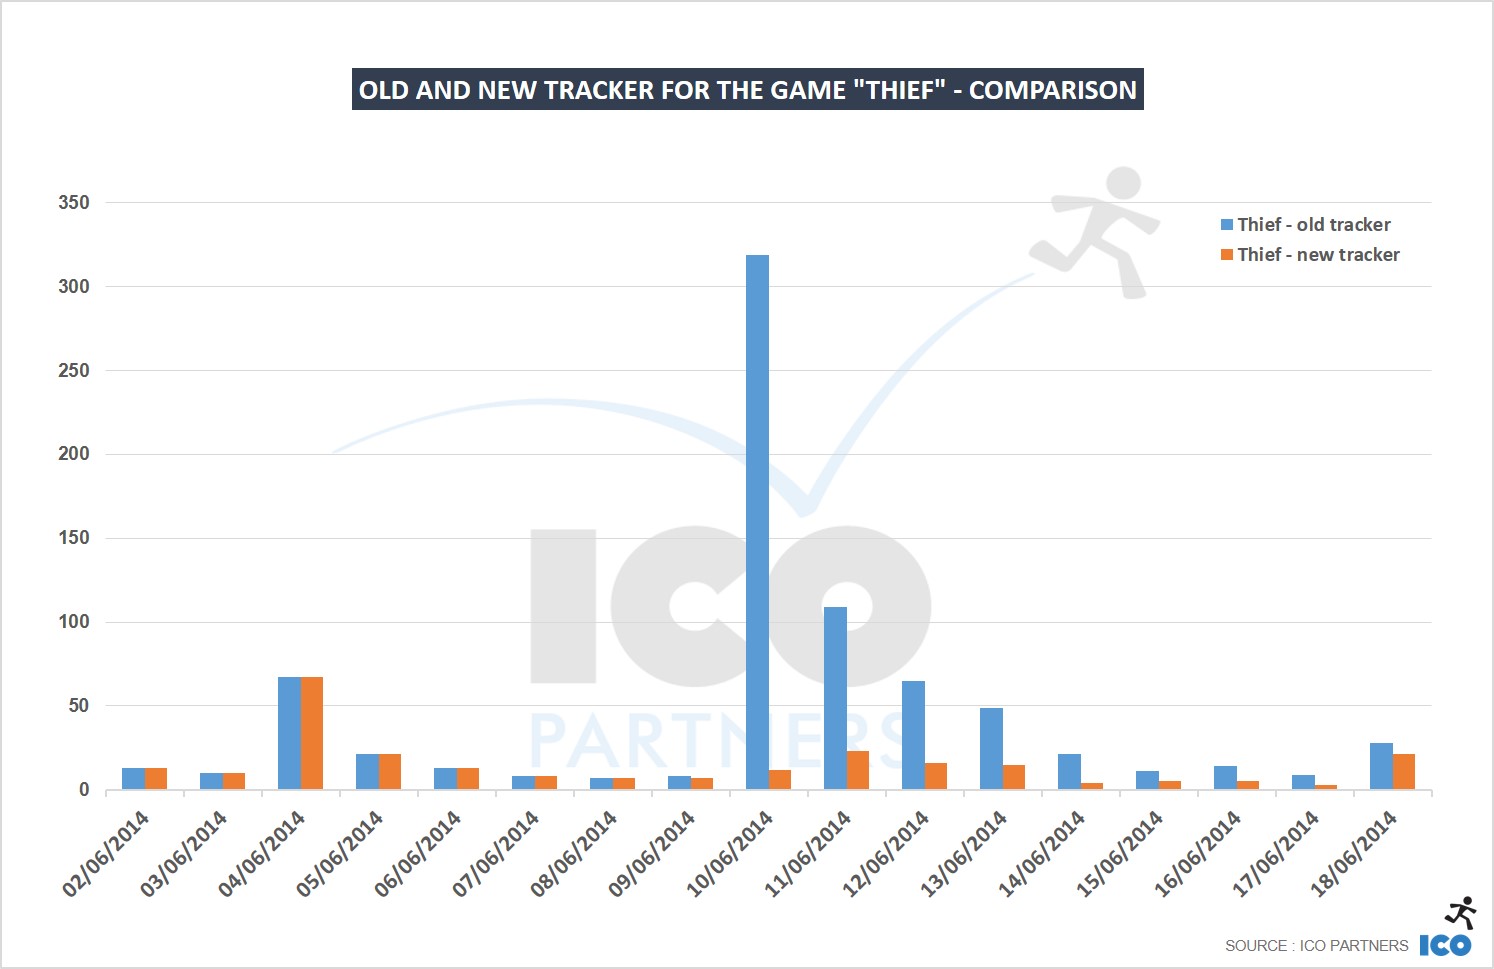
Some trackers require us to be a little clever however. Let’s explain using the example of Thief.
Most games that are problematic are using one commonly used word. In this, on top of looking for the word Thief, we added a number of other words that need to be present in order to create a positive hit. It looks a bit like this (slightly simplified):
You NEED the word “thief” and you NEED one of the following term: xbox OR playstation OR steam
That tracker was performing very well until E3, then Uncharted 4: A Thief’s End was announced and threw up a problem.
We had to recreate the tracker for Thief as follows (this is a simplified version of it again):
You NEED the word “thief”, you NEED one of the following term: xbox OR playstation OR steam, you CANNOT have the word “uncharted”.
This is a chart showing the before and after of that tracker:
We keep a very close eye on the behaviour of the trackers, trying to keep them as relevant as possible and avoiding false positive at the same time.
Quality versus Quantity
Currently (and for the foreseeable future), the Media Monitor is only providing quantitative data. That in itself has already been very helpful to us. We see trends for what are the news the most likely to be picked up, it allows to get some benchmark on the different countries we are working on (we do PR across all of Europe, not an easy task).
We are also very aware of the questions we cannot answer with this data – but we would rather have half the answers than none at all.
Please let me know if you have questions, I will use them to update this post and clarify the notions presented here.
https://icopartners.com/newblog/wp-content/uploads/2014/08/pr-monitoring-002.png256710Thomas BIDAUXhttps://icopartners.com/newblog/wp-content/uploads/2020/04/CRUSHCREATIVE_ICO_BRANDING_LOGO_NavyWhite-01-e1586189748878.pngThomas BIDAUX2014-06-24 10:48:382014-09-23 16:04:25PR Monitoring – How is it working?
Before my general update about April/May, I want to talk about the current hot topic, E3. Below is an overview of last week and the impact of E3 on the media coverage of video games.
The usual disclaimer applies:
The tool I am using is far from perfect. It gets hits on false-positives, some terms are impossible to get hits on and it is somewhat dependent on how clever I am when I create the monitoring criteria for a specific game if the name is quite generic. The tool is also dependent on the alerts I have entered. There are some prominent games that can be absent, I try to add them as I go but I know I always miss some. As I am expanding that list now, do not take the stats as an “end all” proof that X game is totally ignored by the media.
I am only sharing the graphs showing the number of articles for a given topic – we are also using a weighted value based on the sites’ reach, but this time around I wanted to keep things simple. So what you see here is relevant about quantity, not necessarily quality. It is important to note that we purge the results coming from fansites (dedicated to one game) and content farms (that just repost other websites’ content). I am just sharing the current results because I feel they are interesting at illustrating the trend for [the week of E3].
[EDIT – the graph on the games were showing a few games twice (Uncharted and Call of Duty). We are currently tracking games in different ways, one of them is to track the brand name rather than the game name. I have fixed the graph to show the proper result for the game. In the case of Uncharted, the brand name was coming with extra restrictions to avoid false positives, so there were fewer results for it than for “Uncharted 4” that didn’t have any restrictions as the false positives are highly unlikely. Bonus – I have added FIFA 15 that I wasn’t tracking earlier.]
The press conferences
First order of business, I wanted to see the impact of the official press conferences and see their respective impacts on the games they are putting in the spotlight.
Because of the way they are set-up, I ignored the EA and Ubisoft conferences – their top titles had already been relayed at the manufacturers’ press briefings and while my methodology is not 100% perfect, for those, it would just not provide much insight.
Another important thing to have in mind is that I am using the time when the article was published to determine its dependency to the press conferences – and because they all happened at different times I tried to ponder the timings, but there is probably a good margin of error that you have to allow me here.
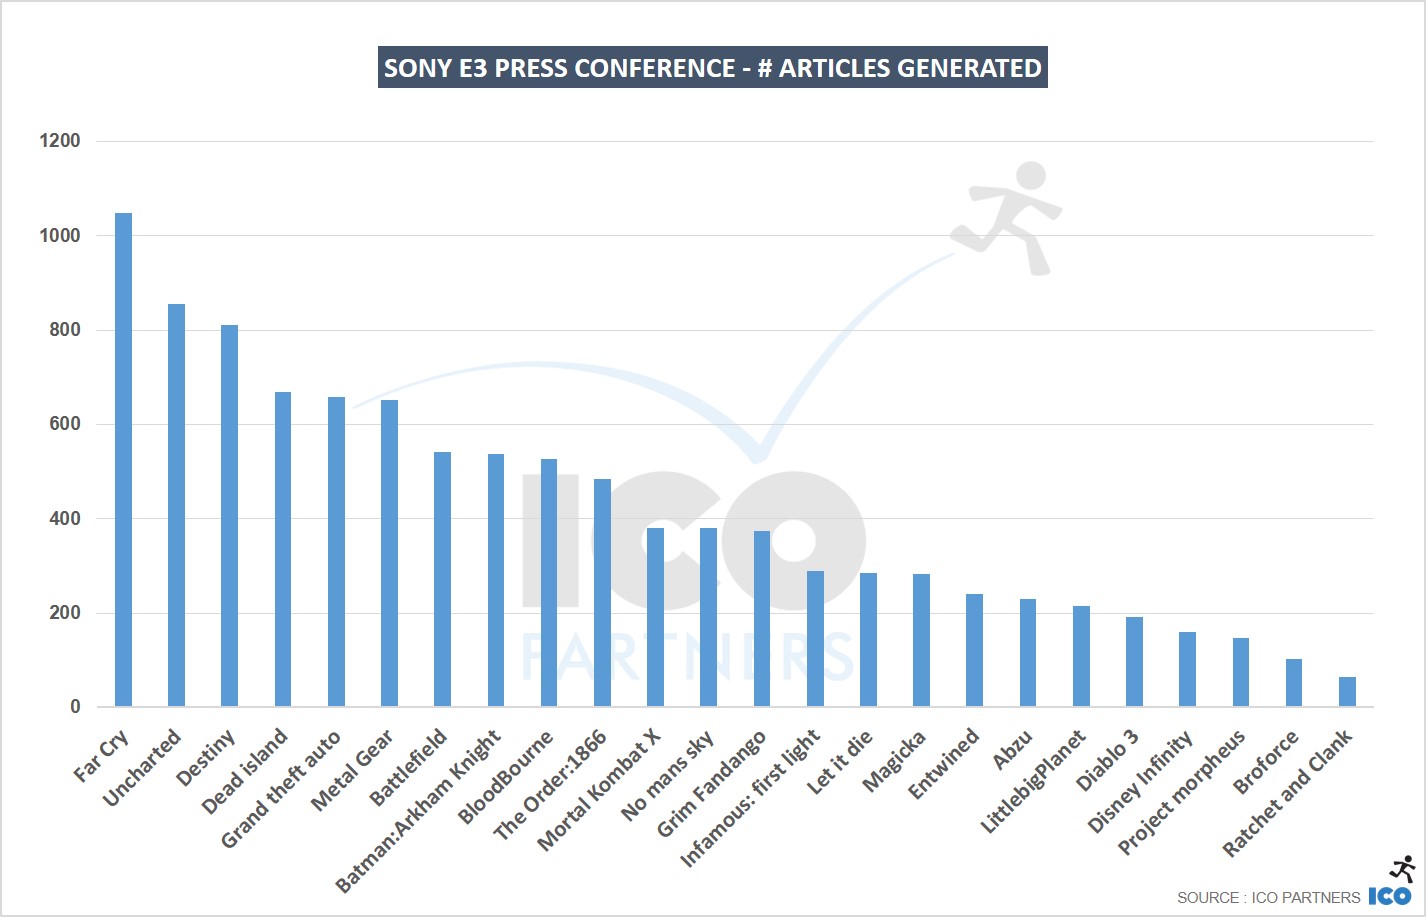
Sony / Playstation
Microsoft / Xbox
*Evolve is not an easy game to properly track – I am trying to avoid false positives and I might be a bit heavy handed on how I do it for now.
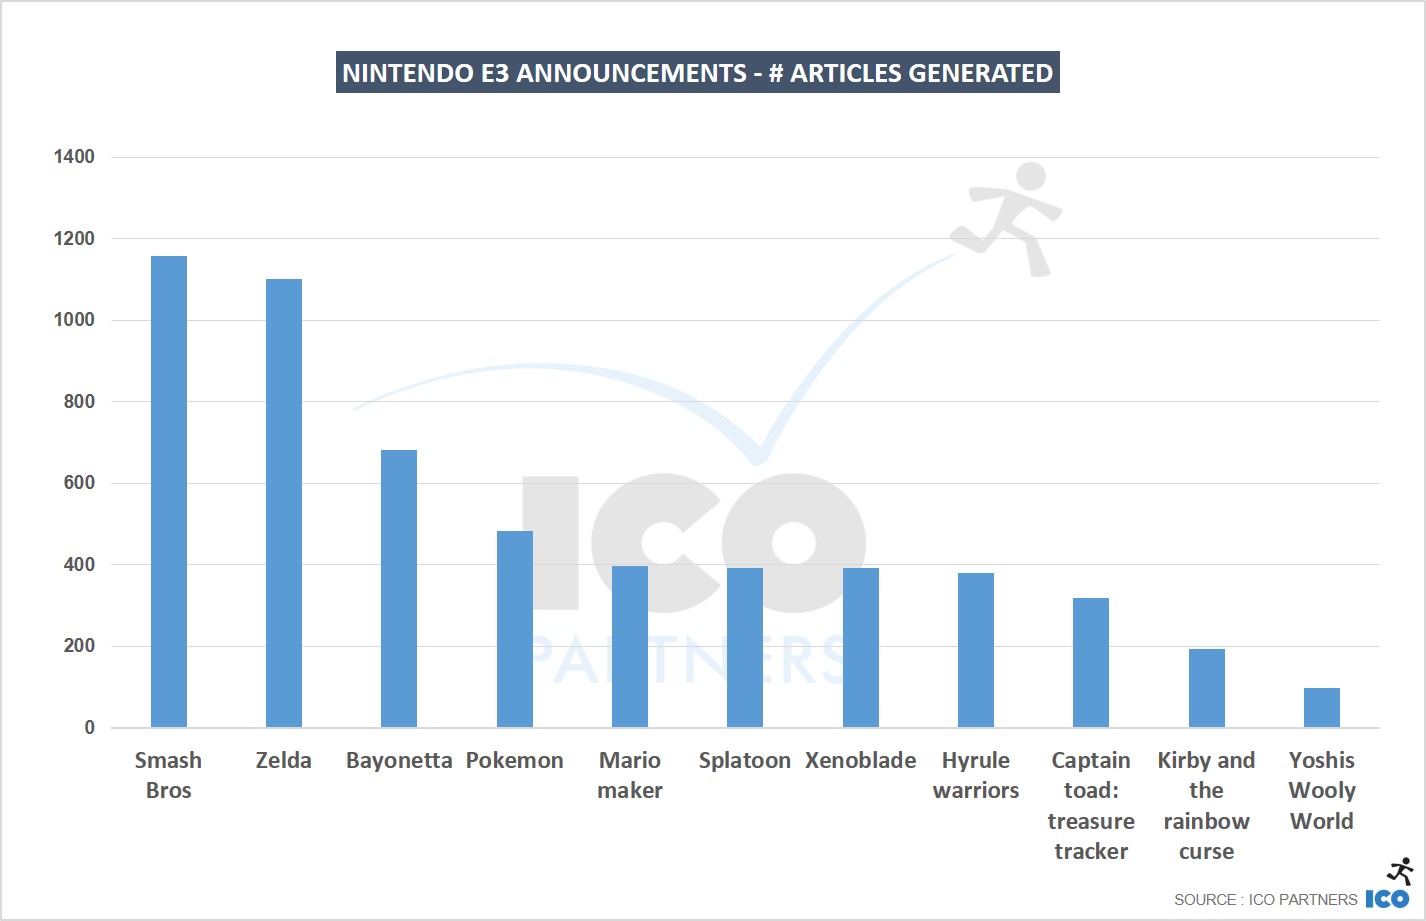
Nintendo / Wii
Comparing them
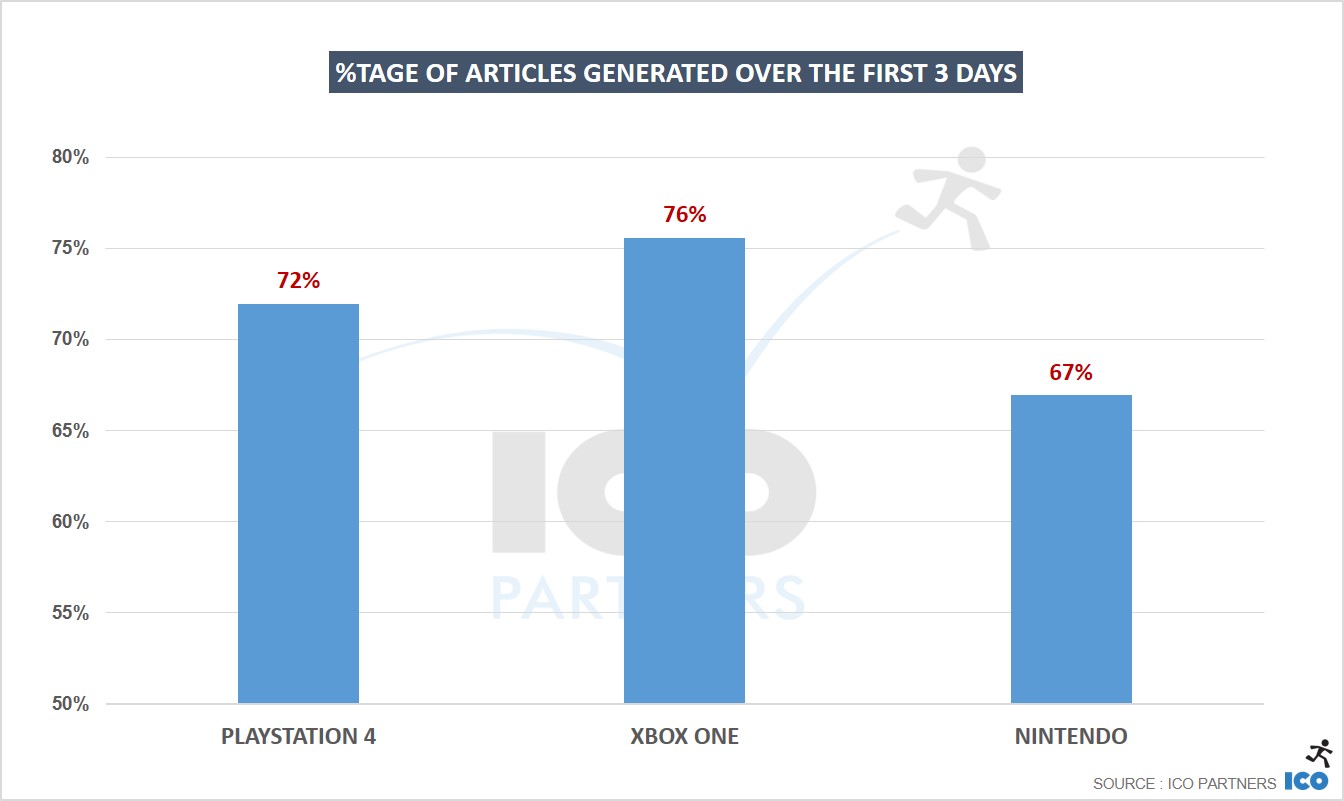
The percentage is relative to all the articles published over the week.
I wanted to see how front-loaded the coverage was for each platform. Nintendo, despite not having an on-site event, are still getting an incredible amount of coverage.
To give some perspective, if you look at the March analysis, Playstation was getting almost 4 times the same amount of coverage as Nintendo across its games and devices, and Microsoft close to 3 times the same amount of coverage. The concentration of attention given to the industry at this time is really helping them as they don’t tend to draw as much attention usually.
The other point it highlights for me is that their format to make their announcement is not less efficient than Sony’s or Microsoft’s, and it is a lot cheaper, with an underlying message that their event is as much for their audience as it is for the press – putting both at the exact same level.
On top of Microsoft being way more front loaded than Sony, the sheer volume of coverage is significantly in favour of Sony. In March, Sony had about 30% more coverage on the PS4 than the Xbox One was generating. For the E3 conferences, Sony got 34% more coverage (despite them going second and having a slight disadvantage in my methodology), and overall for the week, 41% more coverage.
So purely from a perspective of media exposure, it seems this E3 was a significant win for Sony over Microsoft.
This also provides us a very interesting benchmark for the event and the attention it gets. In a week, Sony attained half the amount of total coverage it would normally have in a month.
The whole week
All the data below was collected from Sunday the 8th of June to Sunday, the 15th of June. Weekends are traditionally incredibly slow days for video game media, so it should offer a proper snapshot of the E3 week in that regard.
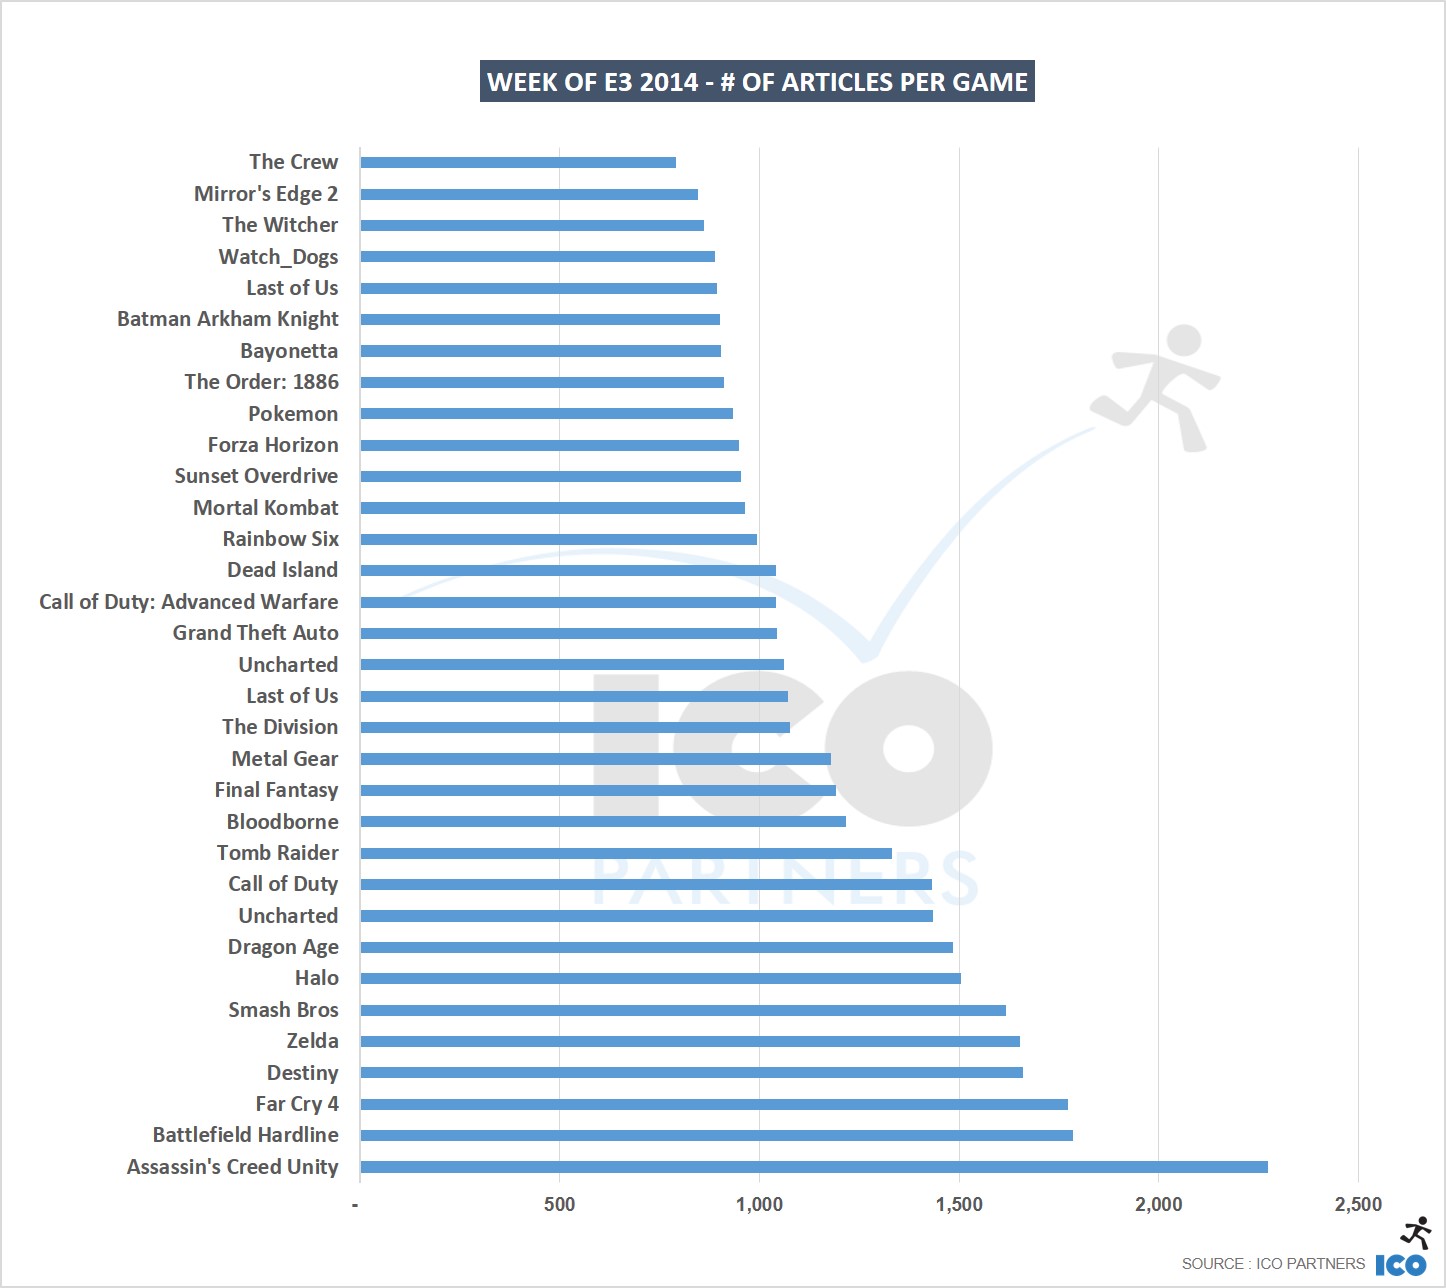
Games
I have limited the list to the games that got the most coverage.
Clearly, a portion of the AC Unity coverage is also coming from the female assassin backlash/controversy and it would have been better without it.
FPS games are still getting a lot of the attention (with Call of Duty surprisingly lagging behind though), and Nintendo’s front hitters are also incredibly well covered with Zelda and Smash Bros ahead of some massive franchises such as Call of Duty, Halo and Tomb Raider.
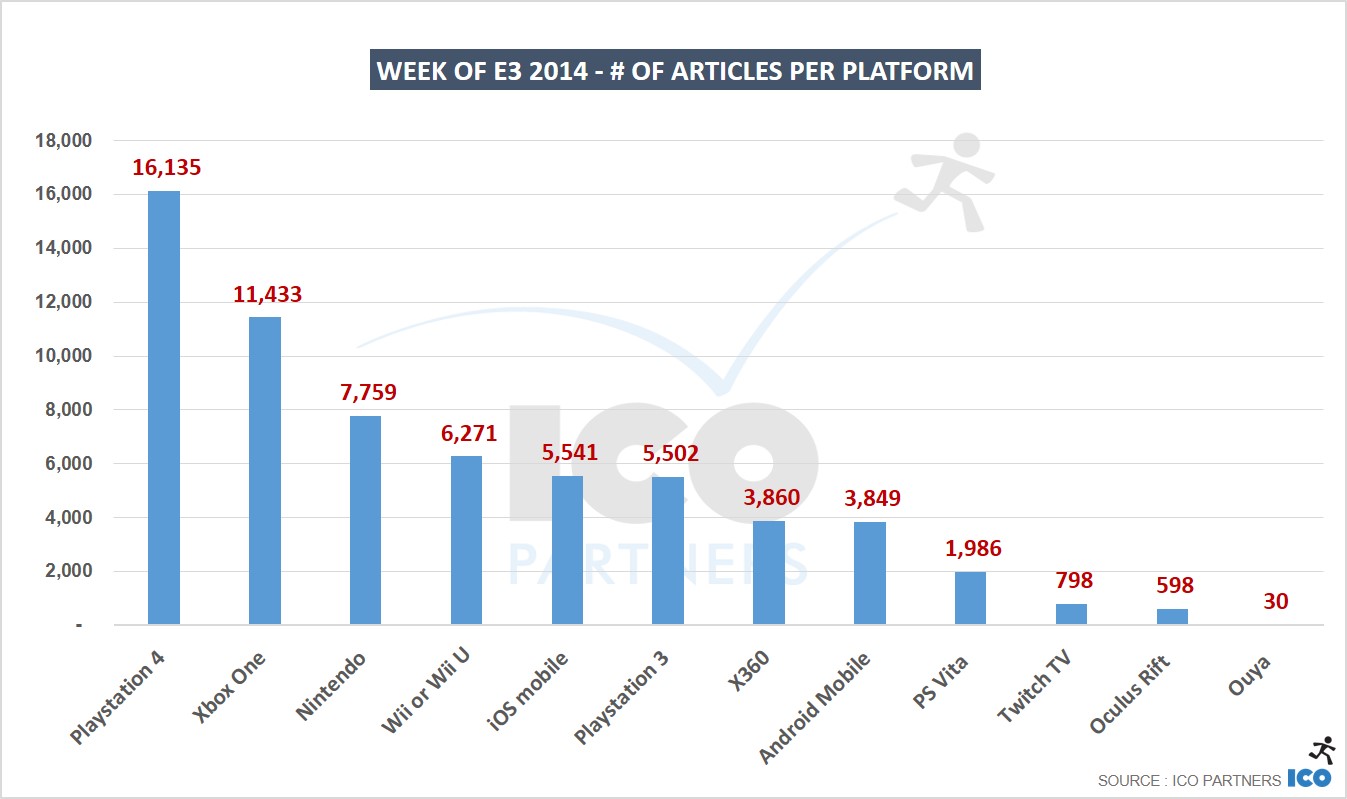
Platforms
I almost feel bad about putting the Ouya in there. I had to actually check to see if they were indeed attending E3. They had more articles on Monday following up their interview with Polygon than on any day of E3 itself.
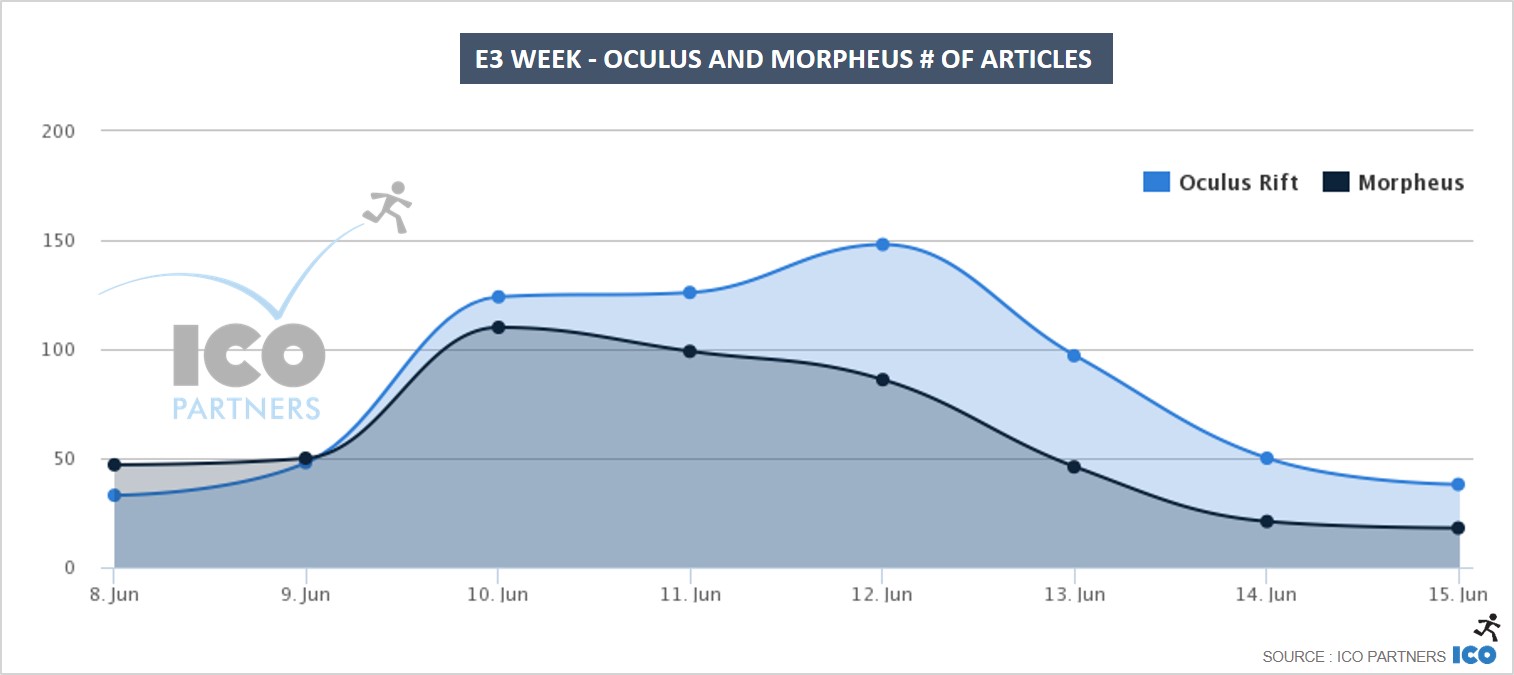
Morpheus and Oculus
Still pursuing my personal interest in the world of VR, I wanted to have a specific look at the media coverage that Oculus and Morpheus both got throughout the week. And with E3 being so much about consoles usually, I have to say I am impressed by the fact that Oculus kept ahead in terms of media attention – of course, if Sony had pushed its own device more heavily, it would be very different – but it is still an excellent performance and testimony to the brand that Oculus is building.
A year worth of data
I have started tracking media mentions for almost a year now, even though I have only started presenting and discussing this data quite recently. This project started a couple of weeks after E3 2013, so I sadly I cannot make any comparison between this and last year’s event. However, what I have is still a year’s worth of data and I wanted to share one last graph, showing the number of articles that mentioned the Playstation 4 every day, from the 1st of July 2013 to yesterday.
See if you can spot the following milestones: gamescom; launch of the console; Christmas; and E3 2014…
This week I was in Berlin for the 2014 edition of Quo Vadis. The event is visibly growing every year and it has shed its German skin to become more international (I think that 3 or 4 years ago, english-speaking lecture were the exceptions, the past two years had zero German-only content; that’s quite a quick change).
I won’t go into the panel about luck in business that I was sitting in on Wednesday, not because it wasn’t interesting, but mostly because one big fascinating chat and I couldn’t take notes. It was great though. Just believe me. Or ask someone who was there and took notes.
Yesterday, I presented a “State of crowdfunding for video games” and as usual, I am sharing the slides of the lecture:
Looking at the slides again, they are not all very self explanatory but the recommendations in the end should help significantly. If you have questions, hit the comments.
https://icopartners.com/newblog/wp-content/uploads/2014/04/crowdfunding-border21.png256710Thomas BIDAUXhttps://icopartners.com/newblog/wp-content/uploads/2020/04/CRUSHCREATIVE_ICO_BRANDING_LOGO_NavyWhite-01-e1586189748878.pngThomas BIDAUX2014-04-11 10:53:062016-12-28 06:25:01Quo Vadis 2014 – State of crowdfunding for video games
A growing activity for us is our PR services that we provide under the ICO Media brand. While this is a topic that we have very rarely discussed on this blog, we are developing in many ways and I might share more on the topic in the future (it is unlikely however, that I will discuss anything specific related to the work we do for our clients).
So, we do PR. But as you may have noticed, I tend to like data and I value information that is backed by numbers and not just intuition. For the past year we have been developing a couple of tools in order to make the team’s work easier and/or more efficient. As a “happy accident” from the building of these tools, I have now a monitoring tool that tracks articles mentioning specific game-related terms in our database of websites (about 5,000 sites IIRC). I have been feeding the tool with specific search for a few month now and what I will share today are the results for the month of February for a number of video games and video games platform.
Disclaimer The tool I am using is far from perfect. It gets hits on false-positives, some terms are impossible to get hits on and it is somewhat dependent on how clever I am when I create the monitoring criteria for a specific game if the name is quite generic. The tool is also dependent on the alerts I have entered. There are manyprominent games that are absent, mostly because my primary interest when I started working on it lied with online games. I am expending that list now, but do not take the stats as an “end all” proof that X game is totally ignored by the media.
I am only sharing the graphs showing the number of articles for a given topic – we are also using a weighted value based on the sites’ reach, but this time around I wanted to keep things simple. So what you see here is relevant about quantity, not necessarily quality. It is important to note that we purge the results coming from fansites (dedicated to one game) and content farms (that just repost other websites’ content). I am just sharing the current results because I feel they are interesting at illustrating the trend for the month of February.
tl;dr: Take all this with a grain of salt.
On to it then.
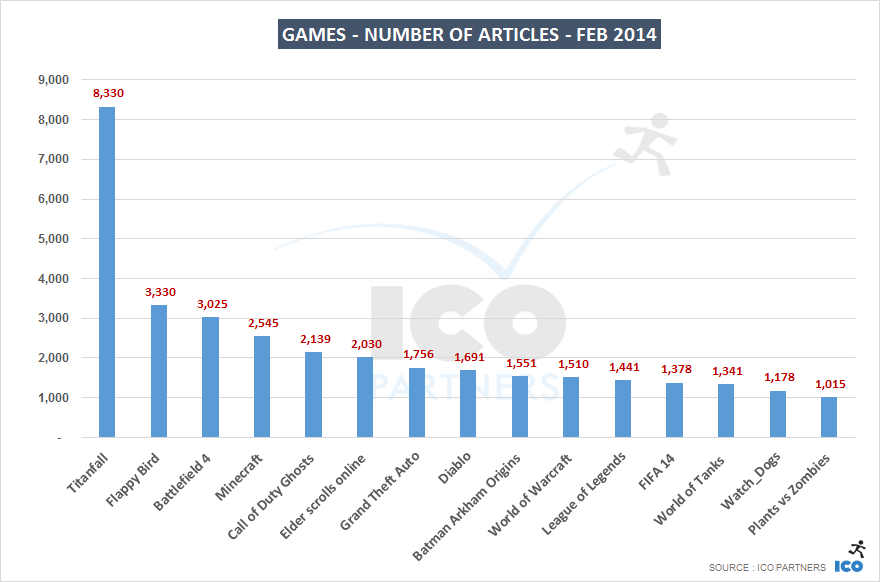
Games
The media like blockbusters. And blockbusters like media. Titanfall being a bit alone for the beginning of the year [arguably, I missed a few AAA that also have launches in the Q1, but let’s not focus on what is missing] and it seems normal that it is standing out so much. They had a lot of actuality as well during Feb. However, you can see that blockbusters from Q4 are still getting a lot of coverage (BF4, COD, Batman and GTA), despite having weaker announcements.
Elder Scrolls Online also stands out – you can see the license in action there as it is unusual for MMOs to get a very wide coverage – with the obvious exception of World of Warcraft. Online games in general tend to get more regularly covered once they have proven their worth – as shown with WOW, but also with League of Legends and World of Tanks as well as (in its own unique way) Minecraft.
It is also interesting to see that Watch_Dogs is below the coverage I would have expected – but you can see now as we are in early March, Ubisoft is cranking it up again.
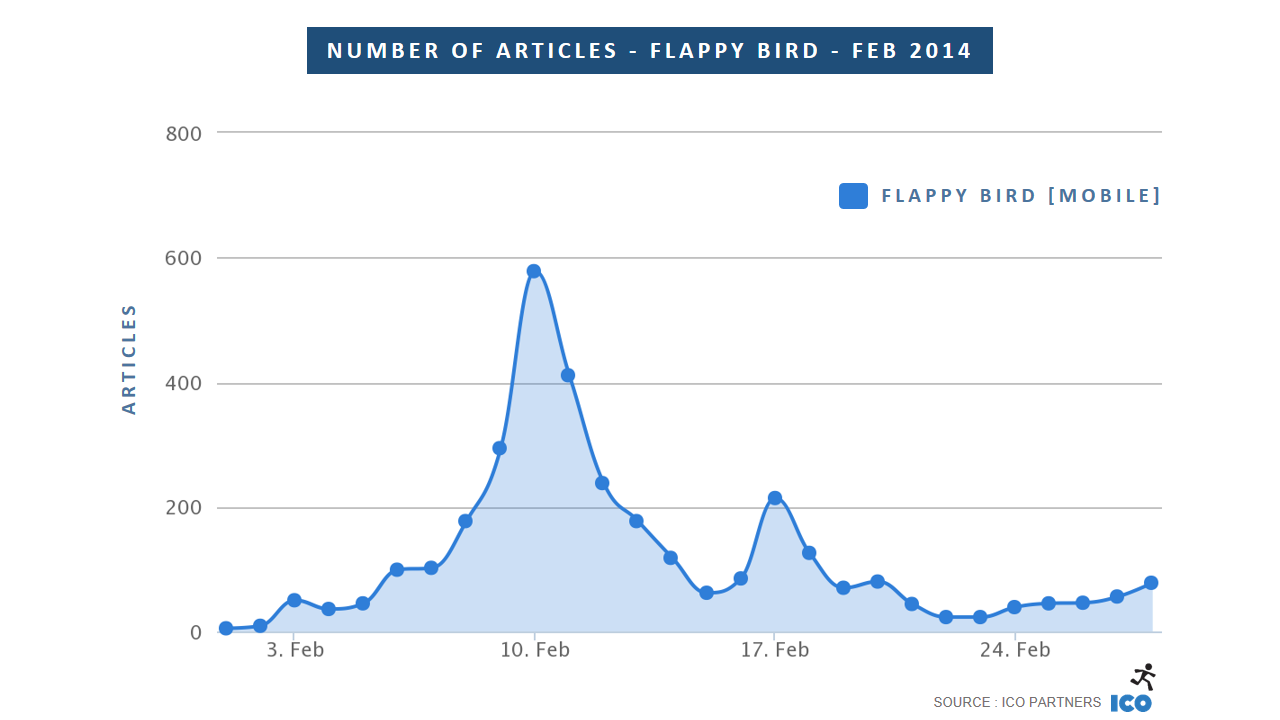
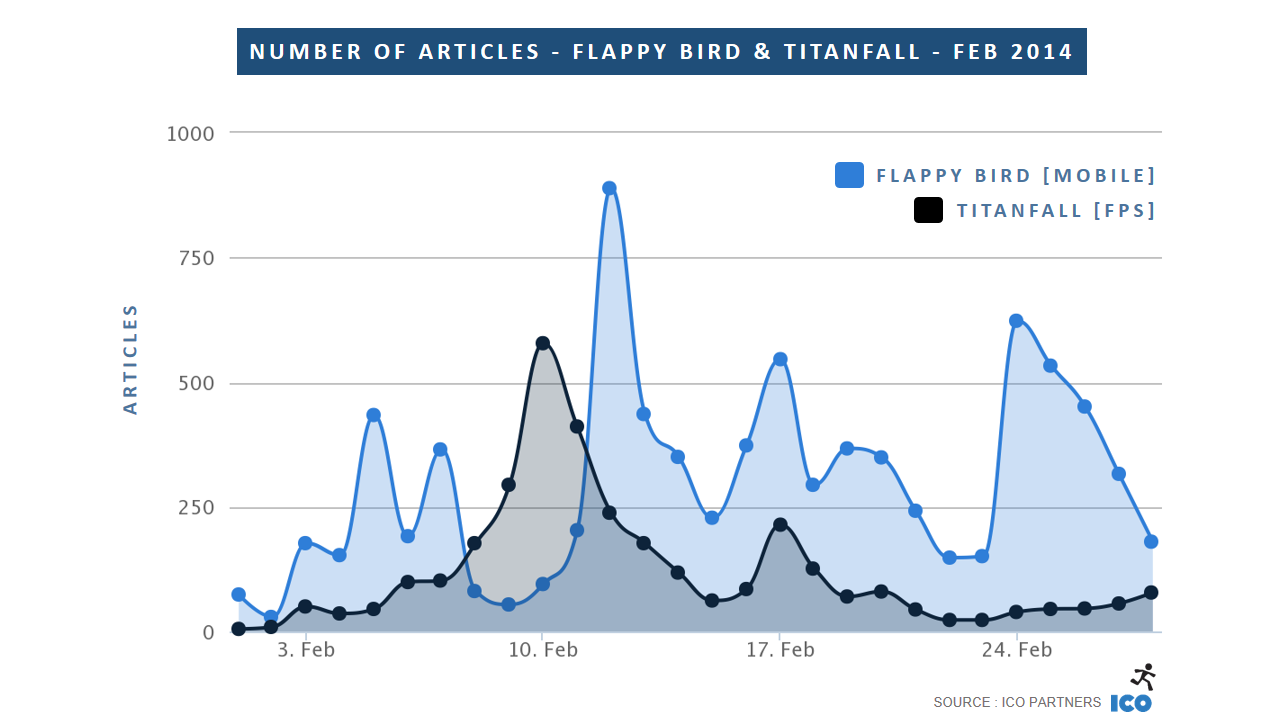
I left the obvious outlier for the end, the odd event of the month and a fascinating one from a PR perspective: Flappy Bird.
I am very confident that even with the AAAs I missed (current trends for March make me think that Castlevania, Assassin’s Creed, Infamous and Dark Souls would have made it in that top 15 had I added them early enough), Flappy Bird would have had that same (second) position. It is obviously a black swan but one that I find fascinating (as anyone who talked to me in the past 4 weeks can attest). Beyond the impossibility to reproduce such a phenomenon, I still think it gives an excellent lesson in what makes media pick up a news: the story.
Flappy Bird hits the mark on so many levels:
– Money (reported daily income for the lone creator from a poor country)
– Drama (the hate towards the creator; the creator taking drastic actions)
– Exotism (Creator living in Hanoi)
A perfect storm… And a good lesson. We very regularly discuss with studios on how they should approach the way they present their games to the media. Way too often they are lacking the story component. Of course you need to talk about your game and what it is about, but putting it into context, presenting a narrative (the studio’s, the origin of the core concept, or anything relevant really) will make it that much more appealing for a journalist to cover it. I would advise strongly against taking this advice as a spin on “there is no bad publicity” – you will always want to be a positive story in the end.
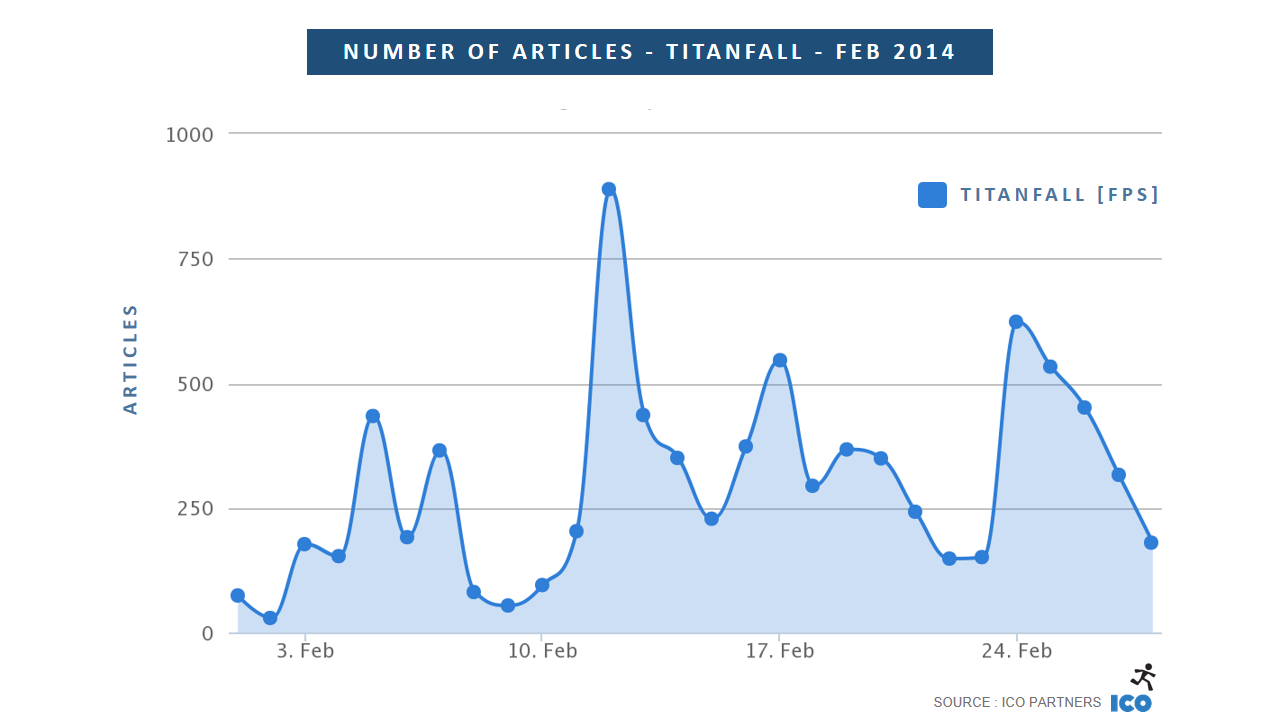
Back to the bird.
Another fascinating aspect is that the game got a lot of its coverage over a weekend. If you look at the Titanfall chart, you see the big drop that happens then. Flappy Bird’s removal started over the week-end, and it was still massively picked-up with a huge follow-up on the next Monday, where all the media that missed it played catch up.
In case you are wondering what is the 17th of Feb bump related to, it comes from the news that Apple and Google were cracking down on the Flappy Bird clones. An aftershock of sort.
This must also be considered within the context that mobile game get very little real media coverage. To give some reference points, Candy Crush Saga, in the midst of January’s trademark debacle, had 725 stories mentioning them over the month, peaking at 172 articles on the day the story broke out.
And, in a most impressive way, if Flappy Bird is absent from the app stores, it has stayed in the news. It averages at 40-45 articles mentioning it every day. That the same average you see for World of Tanks (on their quiet day).
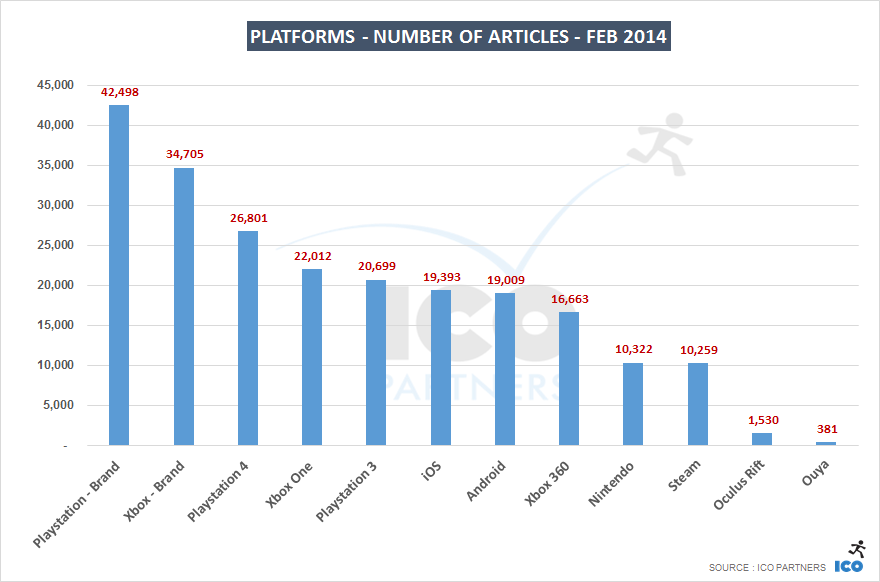
Platforms
If you need to take all the previous graphs with a grain of salt, you need to take the following up with a bucket. I looked into “platforms” that are currently prevalent in the game industry and the number of articles that mention them – however, our database is very skewed towards video game website while still including a number of tech websites. So what you have here is very unrefined data, pooling things together that probably shouldn’t be pooled together. I still find that somehow relevant and an interesting check on what online media are covering.
I was tempted to remove iOS and Android from the chart – they get a lot of their mentions from tech websites that tend to delve into new devices and new OS features and not be very relevant from game industry point of view, but leaving them here doesn’t do much harm and give a sense of scale for the media presence they have.
Unsurprisingly, the “brands” are leading the way in a significant way. If you wonder why “Xbox – Brand” doesn’t equal “Xbox One” + “Xbox 360″, that’s because some articles mention both machines while others only mention “Xbox” without being specific about it.
Our tool is covering websites from all over the Western hemisphere. With Europe and its fragmented landscape, we have way more European websites though, and the prevalence of the Playstation brand there shows in the volume of articles they get, regardless of the generation. It is possibly mitigated by Titanfall’s very strong media presence, considering the game won’t be available on the PS4 – something to research at a later date perhaps.
The fact that Nintendo is getting an equal amount of coverage as Steam is very impressive of Steam (or very depressing for Nintendo?), and clearly showing how much of a power house it has become. I would expect this to continue and the media presence of Steam to even grow with time – despite Valve’s very hands-off approach to PR.
I find the Oculus Rift performance very promising. The device is clearly sparking the imagination, and the novelty factor is working for them. For reference, in February, they announced their exclusivity deal for EVE Valkyrie; shortage of components for the Dev Kit (and thus, shortage of Dev Kits); and they got a fair number of mentions from the announcement that Sony would show its VR headset at GDC. For comparison though, they had about 1,900 articles mentioning the Oculus Rift in January – that was mostly thanks to the Steam Dev Days. In any case, for a technology that is not publicly available and with no firm release date, the interest is there.
I am not sure I need to comment the Ouya media coverage at this stage – but it is one I keep an eye on.
https://icopartners.com/newblog/wp-content/uploads/2014/08/pr-monitoring-002.png256710Thomas BIDAUXhttps://icopartners.com/newblog/wp-content/uploads/2020/04/CRUSHCREATIVE_ICO_BRANDING_LOGO_NavyWhite-01-e1586189748878.pngThomas BIDAUX2014-03-07 10:53:572014-09-23 16:06:10PR monitoring – February 2014 – with a “F” like…


