Posts

On the 13th of May, Kickstarter officially launched in Germany. In just eight days, the service will officially launch in France.

I went back to my data and looked out some numbers on the historical Kickstarter performance for creators from these countries. If anything, it paints an interesting “before” picture to compare to once we get to the “after” period.

Bear in mind that before Kickstarter is available in a specific country, a series of complex hoops had to be jumped through in order to put a project on the platform. A couple of points to keep in mind:

  1. There are a number of projects that are mislabelled on Kickstarter and  listed as American or Canadian while the company developing the project is indeed from another country. Like when (French developer) Ankama went through its Canadian subsidiary for this project (so it doesn’t appear as French in my data):
  2. There are a lot of projects that couldn’t – or didn’t want to – jump through those hoops. A number of them just passed on crowd funding, while others just went to a platform more accessible to them. Like when Frederick Raynal’s Gloomywood went to Ulule to get funding for its game 2Dark (they won’t appear either as I purely track Kickstarter at the moment):


Kickstarter across all categories

While I have relied on the data we regularly collect, each country’s profile is available through the Advanced Search pages on Kickstarter:

German Projects

French Projects

# of successful project per category (prior May 2015)

$ successfully raised per category (prior May 2015)


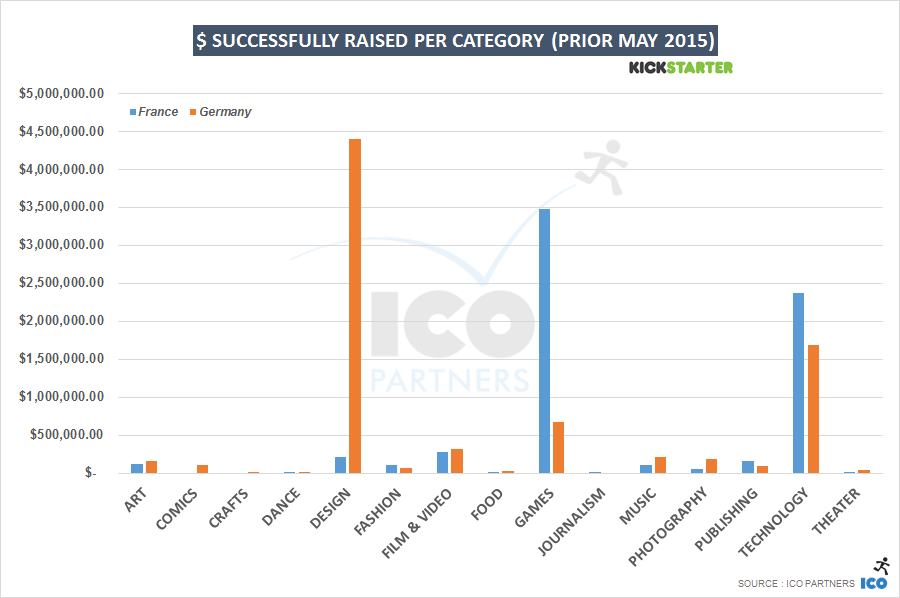
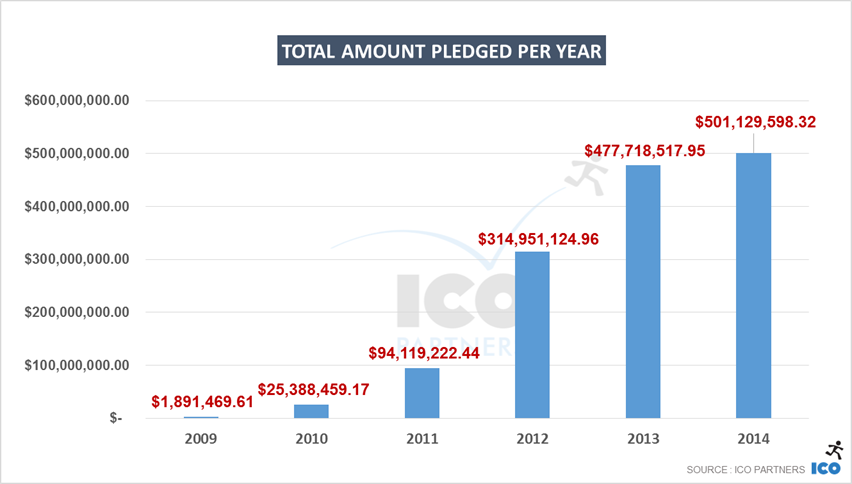
Looking at the number of projects funded, Germany and France seem pretty much on par (156 funded French projects for 169 funded German projects); and this holds true on the total amount raised as well, with around $7m in France for $8m in Germany.

The category spread is very different though. Both countries have a similar amount of success with Technology projects, but the Wireless Smart Headphones excellent success in Germany accounts for close to half the money ever raised in the country:

I will look into the Games category more in depth later.

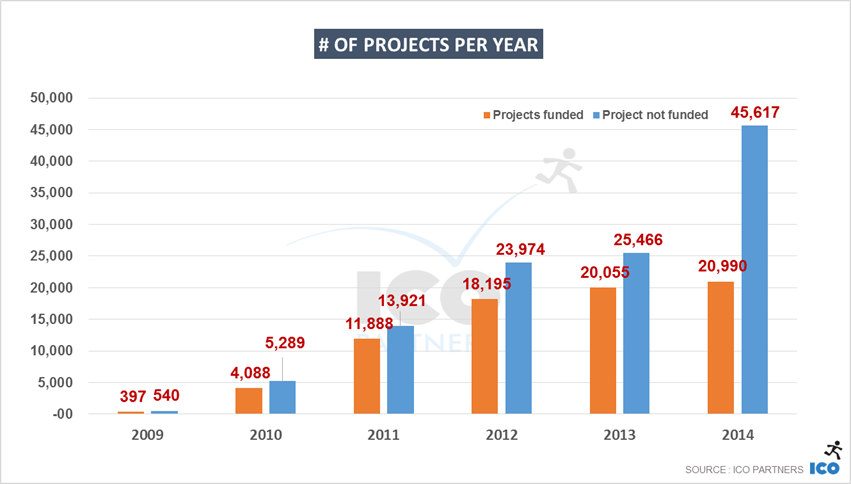
Another interesting comparison I ran was on their relative success to failure ratio:

[ALL CAtegories] projects on Kickstarter (prior May 2015)

The success ratio in France has been around 45% against 40% in Germany. I find that very intriguing – and suspect that Germans are possibly more entrepreneurial than the French; however, the announcement for Kickstarter opening in Germany has been a lot less shared than the French announcement (double the number of shares on Facebook and about 15 times more on Twitter). It may be that the French were waiting more patiently for an official local version of the platform.
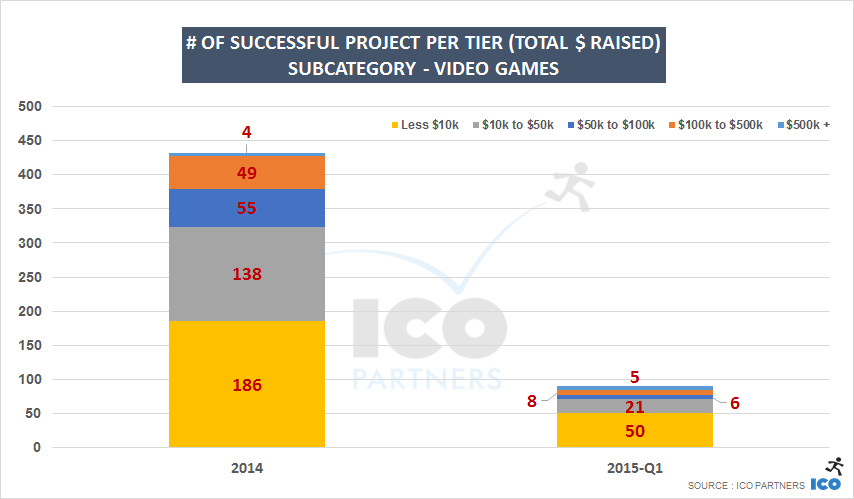
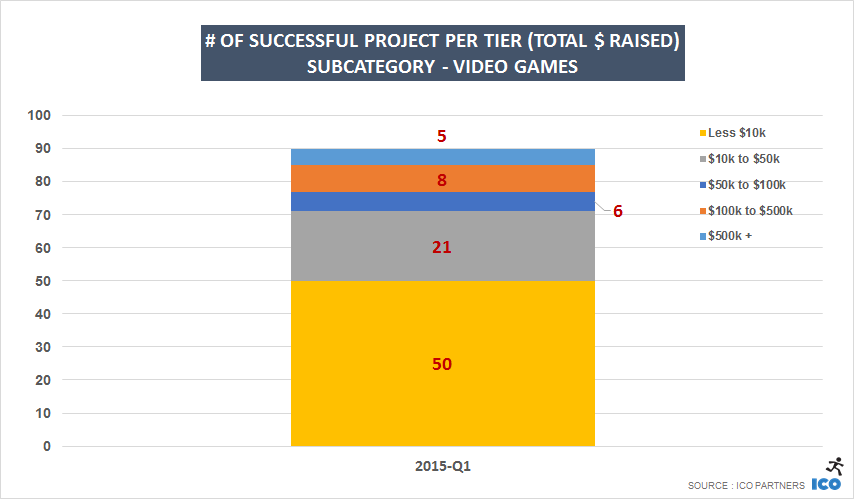
Games projects

[TabletopGames] projects on Kickstarter (prior May 2015)[Video Games] projects on Kickstarter (prior May 2015) [tabletop games] $ raised by successful projects (prior May 2015)  <p data-wpview-marker=

I was surprised to see France ahead of Germany in the Tabletop Games category, when Germany is such a big market for those games. It may be they have a more solid infrastructure for creators, making crowdfunding a less prominent avenue.

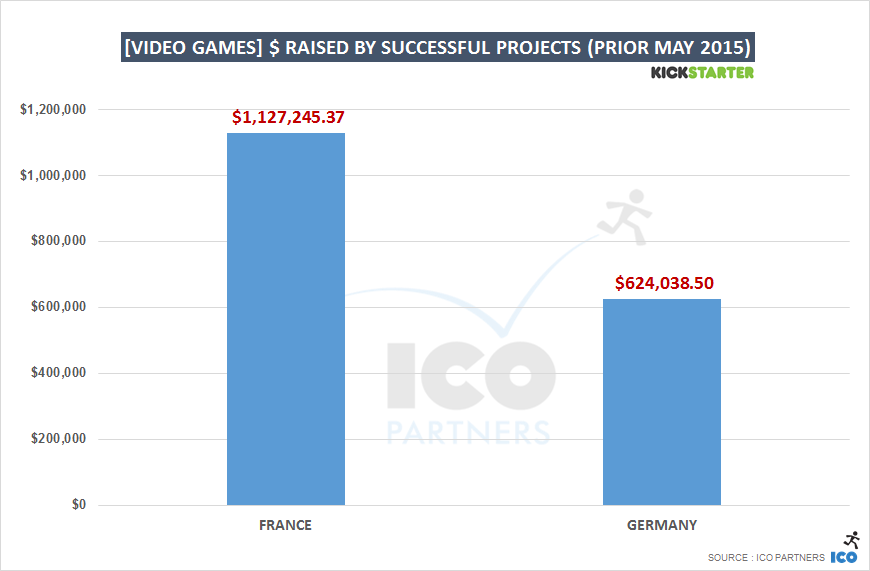
On the video game front, France has had quite a few successes, and while they didn’t have any mega hits, there were five projects raising more than $100,000.

In Germany, there has only be two projects that have been able to raise more than $100,000, despite a larger number of projects launching on the platform.


In a few months, I will check to see the impact of Kickstarter opening locally for a future blog post.


At the moment, from the projects that launched in Germany, PVP MMO Das Tal is currently leading the charge:

In my last blog post on Kickstarter, I explained how there was a significant drop in the amount of money that went to video games over the past year. Being 3 months in 2015, now seems like a good time to review how the year has started, and how it compares to last year’s trends.

Quarter-to-Quarter analysis

Before looking into 2015, I looked at Quarter-to-Quarter trends from the previous years – with the idea of providing more context when looking at the Q1 number for the current year in relation to patterns from previous years.

We are still in the early days of crowd funding, and I only have 2 years to look at properly: 2013 and 2014. Prior to 2012 the numbers are just too low, and 2012 numbers themselves are incredibly skewed by the fact that it took off after Q1.

Kickstarter Videogames - Total # of projects

Kickstarter Videogames - # of funded projects

Kickstarter Videogames - Total $ pledged

Here is how I see the quarterly patterns:

Q1 is usually a quieter month. It’s after Christmas, and there are fewer projects overall. This means that we can expect it to accrue less funds.

Q2 is a very strong period. The best quarter in both years in terms of revenues and a strong proportion of funded projects (slightly higher ratio of funded projects as well, especially last year).

Q3 is the summer. Both years, it had the lowest quarter of money raised. I suspect big projects avoid to launch during the summer (wisely). But it also has the highest number of projects submitted (possibly that’s when hobbyist projects get launched as they have more time then?) – it doesn’t prevent them to get funded though.

Q4 is the pre-Xmas insane rush period for the game industry. Getting visibility then is extra hard, we can see it has a lower than average ratio of projects getting funded (true for both years). However, projects that get funded are well provided, this is the second highest quarter per money pledged. Probably helped by a few larger projects again.

Q1 2015

 Total amount pledged per year Subcategory - video GAMES

Purely in terms of money raised, 2015 is having a great start.

As shown above, Q1 is historically not the strongest quarter, and already more than $8.5 million has been pledged for videogame projects.

# of projects per year - VideoGAMES

Looking at the number of projects though, it paints a slightly different picture. While money-wise, this year seems ahead of 2014, looking at the number of funded projects, we are in the same range as 2014 for the same quarter. And a similar ratio of projects getting funded (roughly 19.5% in both cases).

It means that Q1 2015 has had quite a few very well funded projects in proportion to Q1 2014 (and belying what was seen in Q1 2013 too).


# of successful project per tier (Total $ raised)

# of successful project per tier (Total $ raised) Subcategory - video games


So, I am left with an interesting question. Q1 2015 has started really well, from a money raised standpoint. But looking beyond those five very well funded projects, it seems like that quarter has not been performing on par with last year.

I used to tell everyone that big successes on Kickstarter were always helping the smaller projects, bringing attention to the platform and driving traffic to games that had more limited communication means. I am wondering if that effect has weakened somewhat (it was a very videogame specific effect, other categories didn’t see much of this) and if this is perhaps another part of the evolution of the crowd funding ecosystem for games. I think so, but it is still quite early to say.

And for what it’s worth, April is looking good so far.

Note on the methodology – Reminder on how data is gathered. It is automatically scrapped (thanks to a tool provided by Potion of Wit) from the publicly available data on Kickstarter.com. Because the website is evolving overtime, the scrapping methods is also changing. You may see discrepancies on old data we provided and data provided now. It mostly come from the evolving data scraping process.

Last year I did a general overview of Kickstarter across all categories for 2013 and now seems like a good time to go through a similar exercise for 2014.


I should start with the disclaimers though. In 2014, Kickstarter made a lot of changes to their website, changes that making data collection not as straightforward as before. I strongly suggest to look at this year’s numbers as estimates – all the trends they highlight are probably true but there might be a few inaccurate ones in there too, especially when the related data sample is rather small. Just keep it in mind.

You can find a complete, category per category, Slideshare presentation at the end of this post.

How good was 2014?

It all depends who you are I guess. If you are Kickstarter, 2014 was a good year. More money had been pledged on the platform than ever before.

ks_2014_pledged_all

While the growth in 2014 was not the leap observed in 2012 or 2013, it was still growth. Considering the remarkable successes of the two previous years, maintaining the trend is not a small feat and in that regard, we can probably consider this another winning year for Kickstarter.

For the creators on the platform, the outlook is a bit different.

ks_2014_projects_all

On one hand, there has been more projects submitted to the platform than ever before: an impressive 46% increase from the previous year. When put side-by-side with the number of successfully funded projects, a 5% year-on-year increase, it tells a different story.

Kickstarter looks to have reached the point where the wider audience is fully aware of its existence. As a result it attracts more creators than ever, and we are probably seeing lower quality projects getting submitted in larger numbers.

This is very much illustrated by the percentage of projects that had $0 pledged towards them:

ks_0usd_total_b


Who was it good for?

Back in September, I looked at how 2014 had been for Video Games on Kickstarter, and I did some projections showing that the numbers were going down from 2013. I won’t go in depth in any of the subcategories, but this is an interesting overview across all categories, showing their progress from 2013:

ks_2014_categories_pledged_compared

There has been a significant drop in the amount of money pledged for Comics, Films and Games on the platform in the past year. On the other hand, it was a fantastic year for Technology projects while Food and Design projects also performed very well.

But that’s only half of the story. As we have observed in the past, it is very easy for a few very large projects to weigh heavily on the overall amount of money pledged in one category.

ks_2014_categories_projects_compared

Year-on-year, looking purely at the number of funded projects, the only categories that saw a significant dip are Art, Music and Films. This helps illustrate that Games saw more projects getting funded than in 2013, despite gathering less money…

In a way, this means (in Games at least) that Kickstarter is getting more democratic and benefits more creators with projects with different scopes. And just to illustrate that thought, here is the Games category broken down per funding tier:

ks_2014_projects_games_tiered

You can find this kind of break down for all categories in the Slideshare presentation…

All things considered though, we can say that it was a good year for picnic lovers.


What changed in 2014?

Kickstarter added another four currencies to its platform and opened projects to five new countries: Netherlands, Sweden, Denmark, Norway and Ireland.

The overall impact on the platform was not very significant:

ks_2014_currencies_all

The projects in GBP are still doing relatively well – along the same scope as last year.

It is worth noting that the Danish projects, the best funded of the newly added Scandinavian countries, did so through a few projects that raised more than $250 000 (including the very well performing Sitpack project). Anecdotally, 75% of those projects are Design projects. Denmark, right?.

Meanwhile, there hasn’t been a single EUR projects above the $250 000 line. Of course, large EUR countries such as France and Germany don’t have a direct access to Kickstarter and generally create their projects either through USD or GBP. It is worth noting however that the EUR integration didn’t seem to have much of an impact on Kickstarter’s development.

2015 will be interesting in regards to currency. One challenge that Kickstarter faced was that payments in USD were made through Amazon Payments, while all the other currencies were using an in-house solution. It meant that existing backers, with their card on record on Amazon, had to go through an extra step to be able to pledge money to a project not in USD. Now, all projects will share the same payment platform, regardless of currency. It should help the “exotic” currencies and remove a potential friction point in the process. On the other hand, no longer using Amazon Payments may have a negative impact too. Only time will tell in that respect.


Kickstarter in 2014 – Across all projects categories

UPDATE – I had a chat (very friendly) with Kickstarter and they highlighted that it was hardly fair to compare video games and tabletop games between 2013 and 2014 the way I did as they have added 5 new subcategories that further dilutes projects and increase the perceived dip for the two historical main subcategories. I have reviewed my numbers and added the new subcategories to the relevant pre-existing ones.
The slides represent this change now. To be clear, only the last slides were affected – the Video games and Tabletop Games sections.